Table of Contents
URBAN BEE LAB
In many industrialised nations, bee colonies are now threatened. Amongst the reasons are pesticides and parasites - but the compromised state of the foraging areas for bees is just as worrisome. Bees are bio-indicators and they reflect the health of their surrounding ecosystem and the cumulative effects of different pollutants. The aim of our research is twofold: to investigate whether we can use the bees as remote environmental sensors and to investigate whether, through monitoring the colony’s behavior, we can get advance warning of problems that may cause colony collapse. We communicate our findings via art projects to the public at large. By this, we make citizens aware of the increasingly negative effects of our life styles and methods of industrial production.
The Urban Bee Lab is a group of artists, beekeepers, technicians and scientists. Since 2009 we study the tight interaction between city honeybees and urban ecosystems. In all, more than 40 people, coming from backgrounds in biology, audiovisual and interactive arts, industrial, electrical and civil engineering, computer science, music and mathematics contributed during the past 5 years.
For many years now, we have been creating experimental set-ups using sustainable beehives that have been augmented with camera's, microphones, sensors and sensory processing algorithms to analyse the state of the colony, the quality of pollen and the behavior of the bees.
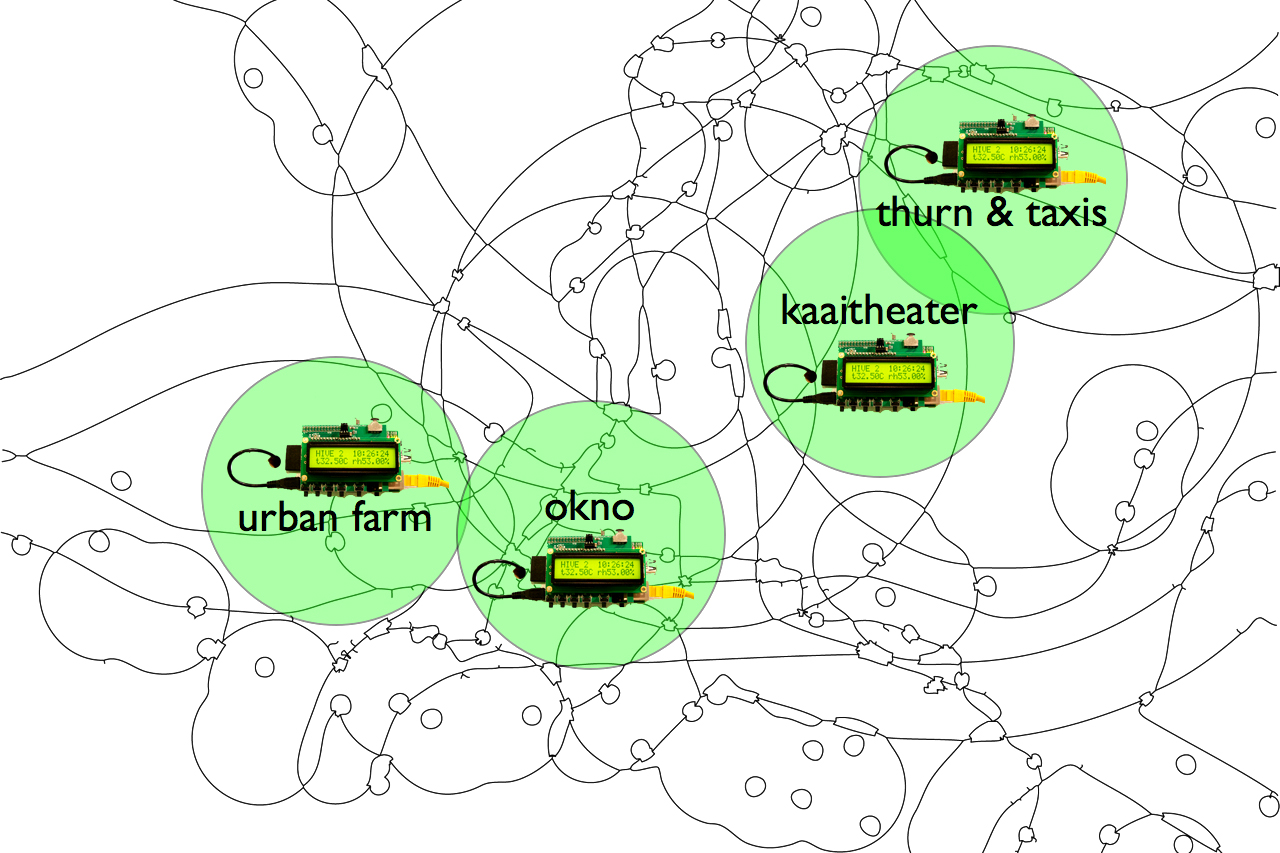
These “Intelligent Beehives” are progressively linked in a European- wide network and the data is being made available online.
the SOUND BEEHIVE EXPERIMENT
This particular webpage describes various aspects of our work with the 'sound beehive'.
We have been developing a monitoring device that is based upon the continuous monitoring of the colony's buzz: a non-intrusive scanning device for controlling the colony's health & development. We also have been adding video monitoring (outside and inside), which gives us a full spectrum of possibilities for colony monitoring and environmental surveillance.
As bio indicators, honeybees provide us with a constant stream of information on the environment (urban, countryside) on which they forage (activity, pollen, nectar). Diseases like colony collapse disorder and environmental problems like the use of pesticides could be analysed in a different way by monitoring and analysing the daily activity (audio, video) of several bee colonies over multiple years.
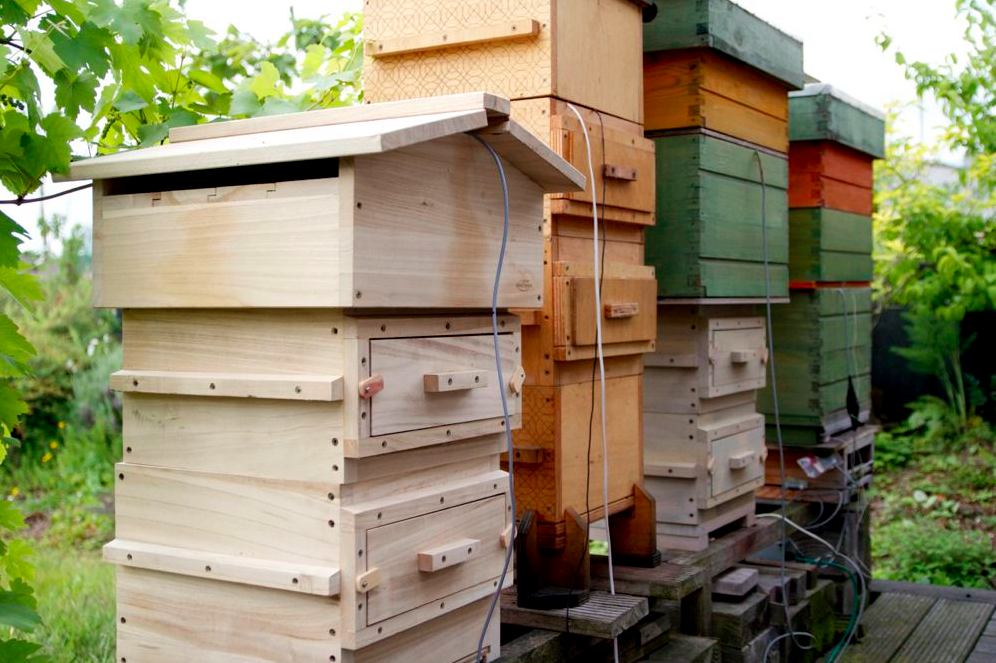
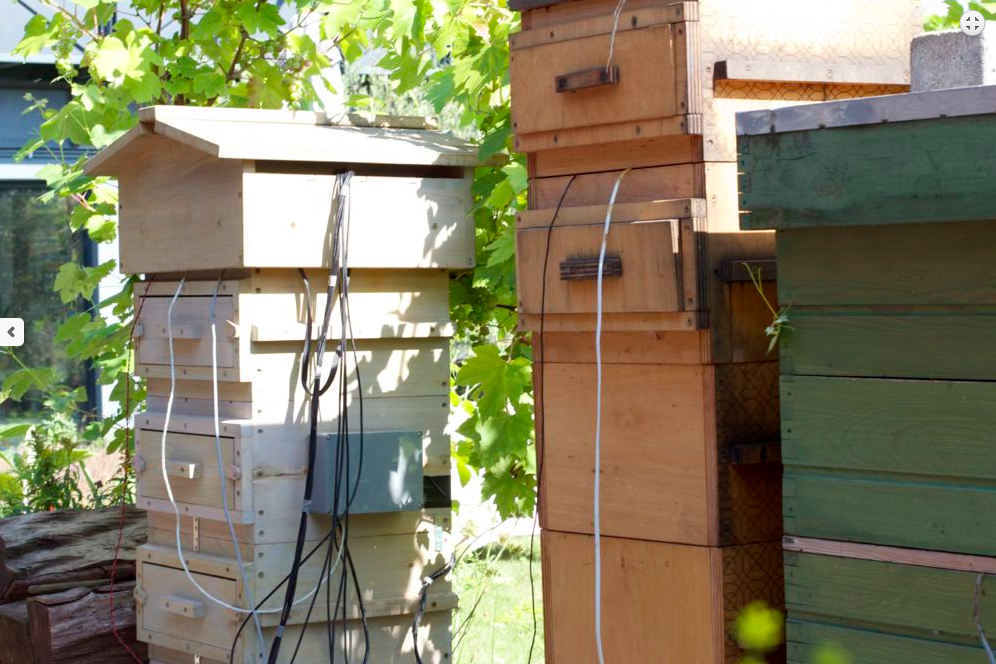
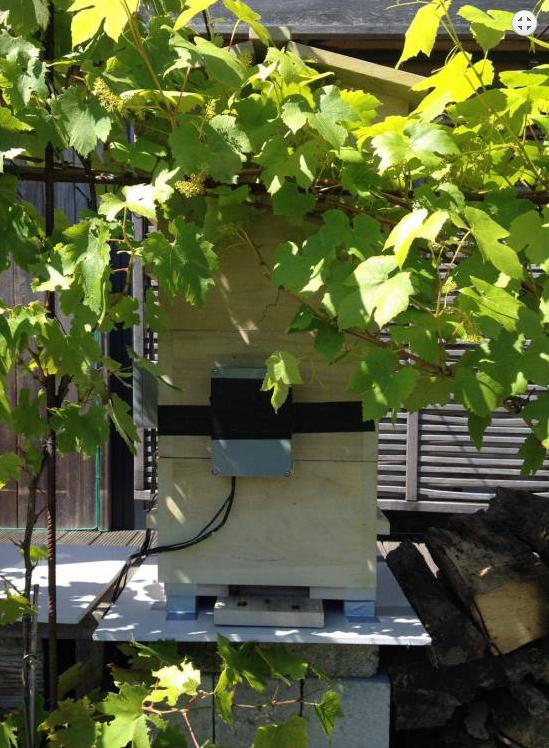
In our test station in Brussels city center, we have 2 beehives equipped with off the shelf-technology for monitoring bee activity at the landing platform (2 x video, outside and inside) and for monitoring the health and development of the colony by sound recordings of its activity (8 x audio, inside). The test station also hosts 4 non tech. equipped beehives which are usefull to make observations at the flighthole/landing platform and to compare these findings with the results of the digitally monitored hives.
One 'sound' beehive is a Warre Beehive model that was ordered at Holtermann in Germany. This beehive is made from first quality lime wood and once treated with ecological paint and a mix from propolis and ethanol, it will stand the temperate weather without problems.
The other beehive is designed and cut at the Green FabLab Valldaura, Barcelona. It is tatooed with a lasered OpenStructures grid.
the workplan for the 2014 observation setup of the sound beehives is as follows:
1. hardware setup : installing a low cost audio and video equipment with off the shelf components (description below)
2. installing environmental sensors inside the beehives and outside in the apiary (description below)
3. collecting the audio & video datastreams and secure these recordings on regular time intervals (x-times/hour) without interruption ⇒ (challenge! - triple checks + plan B)
4. add annotations to the digital data: regular observations at the flighthole (landing platform) and regular inspections inside the beehives;
collecting bee-samples for microscopic analysis + annotations on first-view morphological observations (e.g. deformed wing syndrome or other illnesses)
5. realtime online visualization of the dataflows (audio/video/sensors inside/sensors outside) in graphs on opensensordata.net
6. setting up databases (offline) for storage of audio/visual files and sensor data; basic retrieval of data information (fields of the databases)
7. analyzing the video & audio files using statistical techniques, data mining, pattern recognition, bee counting
⇒ collaboration VUB - AI-lab
8. install a realtime streaming setup for additional microphones and video camera's
ETHOLOGICAL APPROACH
The focus of ethology is on animal behaviour under natural conditions, as opposed to behaviourism, which focuses on behavioural response studies in a laboratory setting. The discipline of ethology is generally considered to have begun during the 1930s with the work of Dutch biologist Nikolaas Tinbergen and by Austrian biologists Konrad Lorenz and Karl von Frisch, joint winners of the 1973 Nobel Prize in Physiology or Medicine. Ethology is a combination of laboratory and field science, with a strong relation to some other disciplines such as neuroanatomy, ecology, and evolution. http://en.wikipedia.org/wiki/Ethology
We have been building a laboratory to study the development of the colony through its own sounds. The buzz of a colony and its behaviour and conditions are quite related. It is possible to know if a hive is queenless or if an important amount of nectar has been collected simply by listening to it.
For this experiment we follow a systemic approach to raise understanding of the characteristics of the colony through relationships with its environment, through patterns discovered in the collected audio, video and sensor data, and through contextual observations. We study the bees as a re-generating network of actors (autopoiesis), all of them contributing to the organisation and well functioning of the colony, the super organism.
Specific hardware and software is developed in order to continually monitor the sounds on different spots in the beehive.
We upload our annotated video and audio data for public viewing in our opensource videodatabase pandora. All corresponding sensor data are publicly available on opensensordata.net. The information archive grows as more audiovisual observations and more sensordata are added over time.
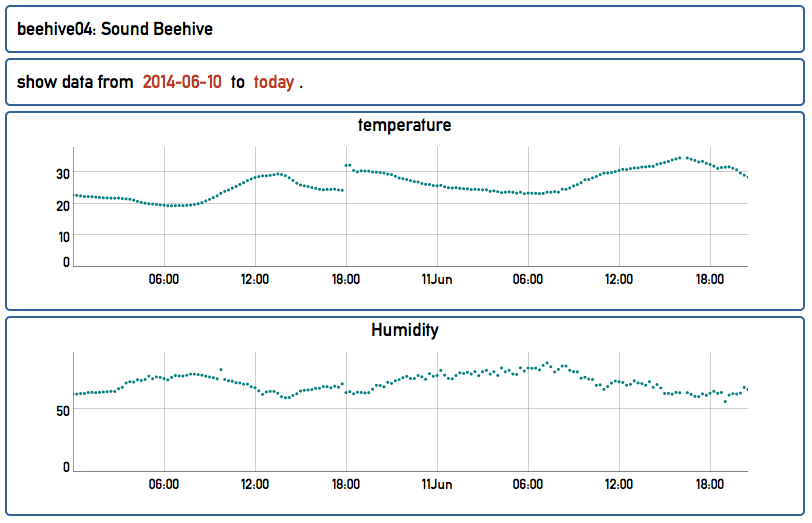
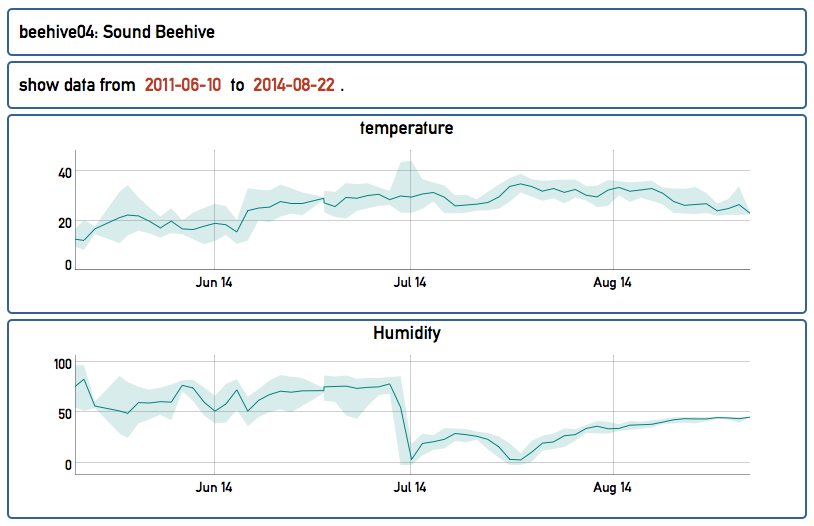
collected sensor data and related observations before june 2014:
1) environmental data related to the temperature and humidity in the beehives have been recorded for many years. The datasets are available online: datasets, datasets and more datasets.
2) different small low power sensors across the garden are being added to make localized observations: soil humidity and temperature, air humidity and temperature, solar radiation, Co2 (WASP mote, P2P foodlab sensorbox)
3) a photographic and video archive of the garden and the apiary has been maintained for several years ⇒
urban-artfarm-2012
urban-artfarm-2013
urban-artfarm-2014
video database: documentation on Bee Monitoring
video database: documentation on OpenGreens and Urban Artfarm
documentation on observation setups before the sound beehive experiment (starting june 2014):
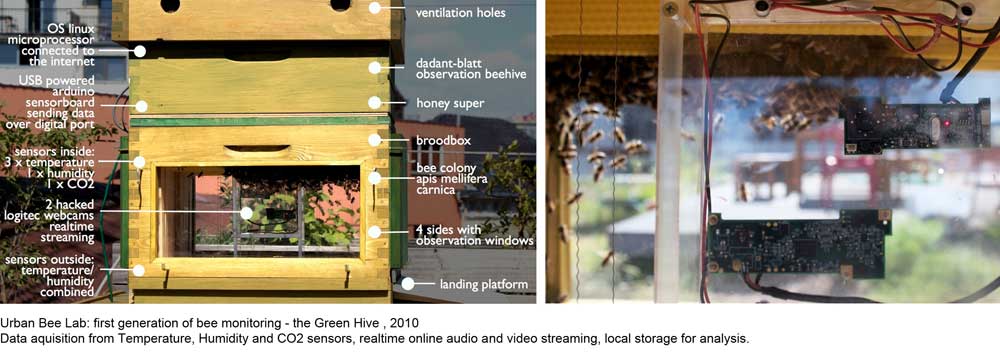
In 2010 we have been building a monitoring set up based upon a Dadant Blatt observation beehive. In the broodbox we inserted 2 infrared-hacked webcams and several sensors (Co2, temperature and humidity). The activity in the beehive was recorded at 15 fps, stored locally for a while and every 30 minutes the video data was send over ethernet connection to a dedicated computer connected to the internet. From there, all data was streamed online. video from the 2010 set up.

In 2012 we have been setting up the Transparent Beehive experiment. For the time of a bee-season, we were observing the development of a bee colony in a custom made transparent beehive, equipped with 12 piezo contact microphones and temperature and humidity sensors. The traffic from the bees through the tube that connected the beehive with the outside world, was streamed in realtime online. Video from the 2012 set up.
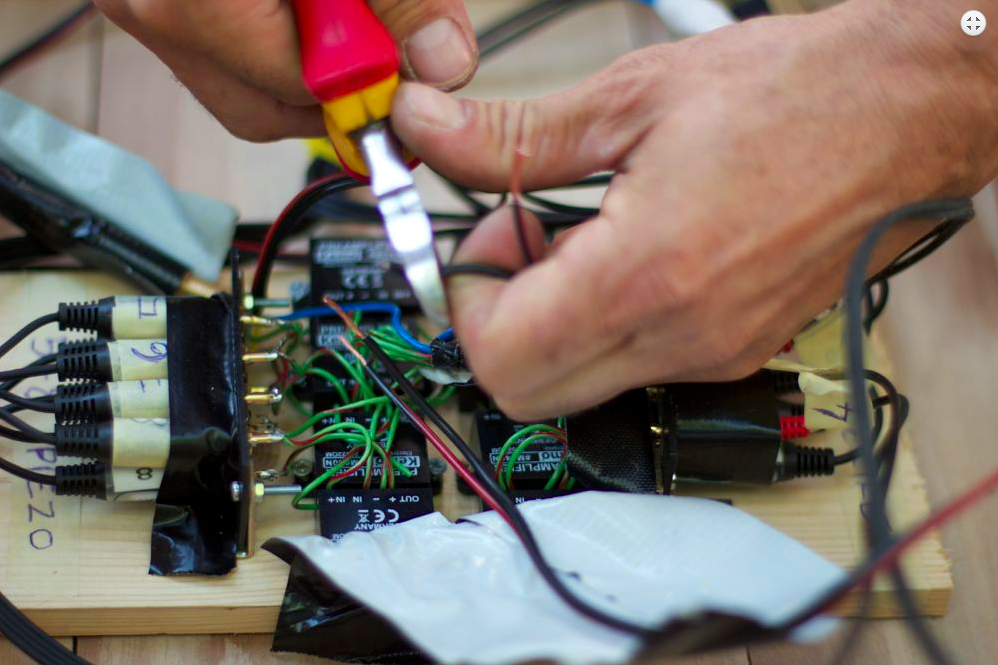
AUDIO TOOLBOX
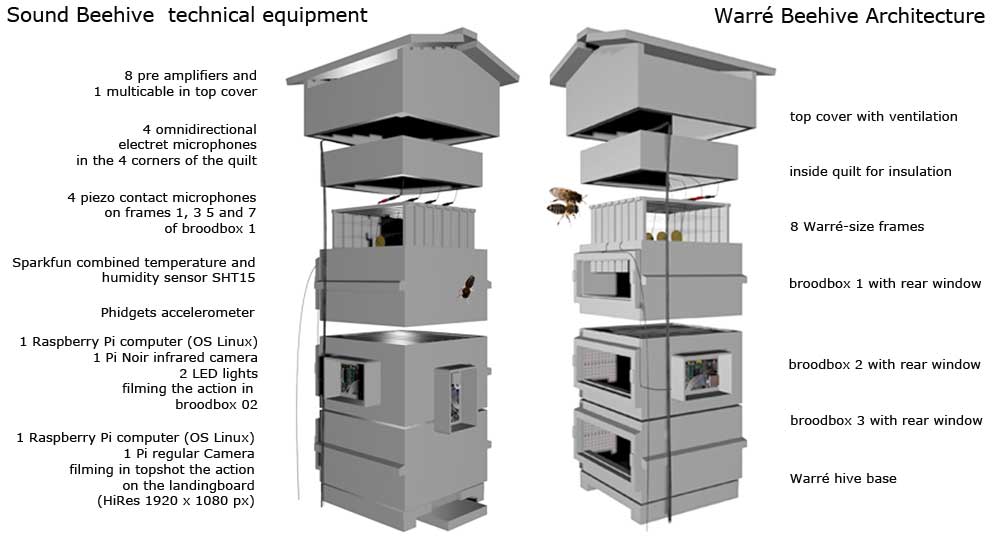
The goal is to monitor the colony's behaviour by recording its sounds inside the beehive. Therefore we have been installing 8 microphones:
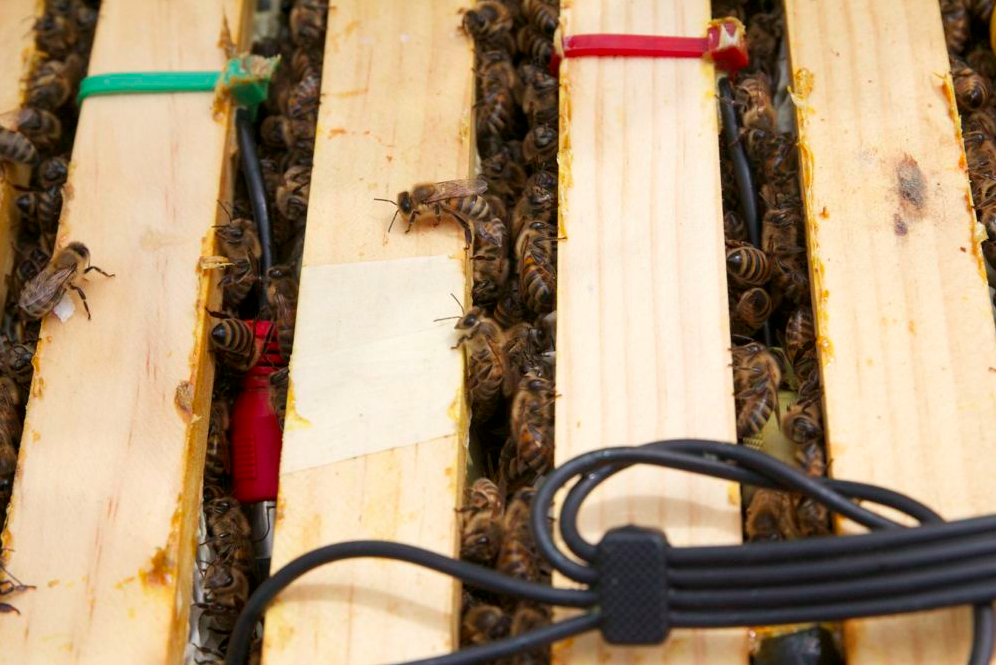
- 4 electret omnidirectional microphones (at -10db amplification) in the 4 corners of the topcover of the hive;
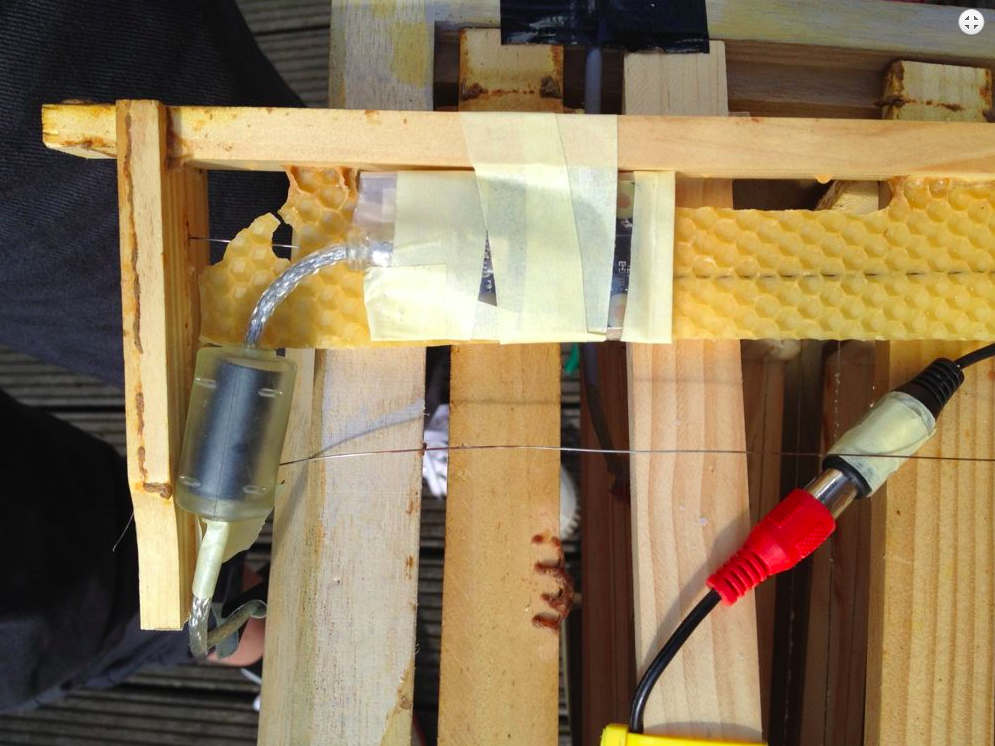
- 4 piezo ceramic contact (pressure) microphones on 4 frames of the broodbox, converting vibrations into an electrical signal and to record sound in challenging environments;
- the necessary preamps;
- the battery for preamps (meters away from the hive to avoid EMF);
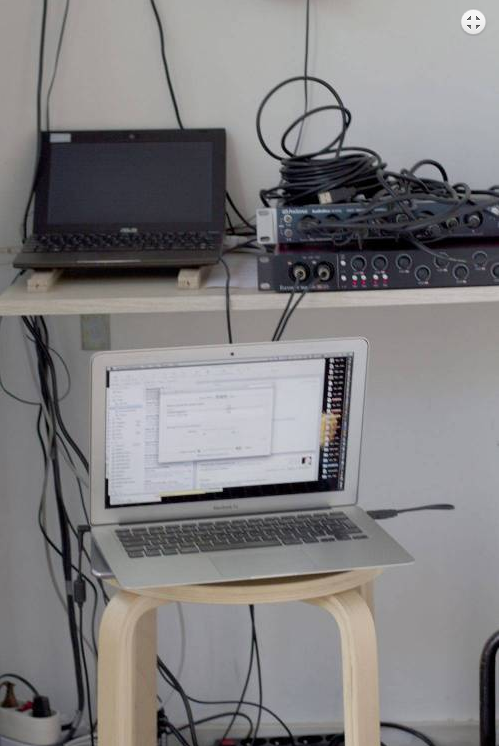
- an 8 channel sound card Presonus;
- an Asus computer for recording and processing;
- a NAS (network assisted storage) for storage of files in database.

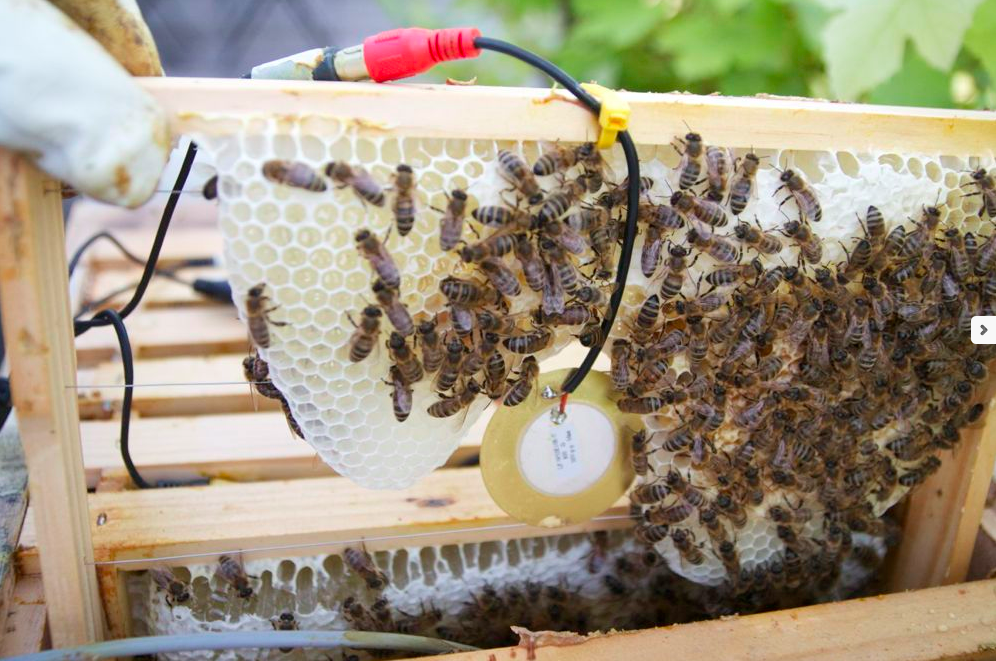
The electrets microphones are placed in the top cover, protected by the quilt of the Warré hive to avoid bees having access to the microphone.
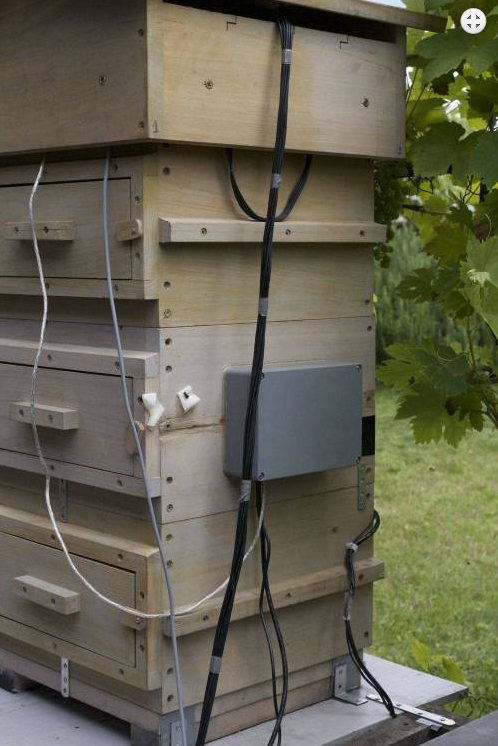
The Piezo microphones are attached with thin metal wires in the frames number 1, 3 5 and 7 of the brood box. All microphones are connected to pre-amps attached to the inside of the hive's roof. The pre-amps are powered by a battery that is located a few meters away from the hive to avoid the creation of EMF.
The settings of the microphones are controlled by a 8-channel soundcard (Presonus) and recorded by an Asus computer running on Linux, on which applications were developed to save the soundfiles and process them.
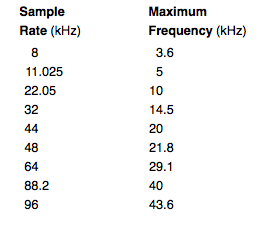
Actual Sampling Rate is 44,1 KHz. First we thought this would be overkill as the frequency spectogram of the beesounds reaches only 3500 à 4000 kHz (doubled by Nyquist theorem this would give us a standard sampling rate of 11,025 kHz) but after running tests we concluded to keep the 44,1 kHz standard as with lower standards we loose a lot of detail in the sound files. This quality is not needed for the scientific experiment, but it is important for the aesthetic presentations of the experiment.
Every :00, :15, :30 and :45 minutes of every hour a 3-minutes (180 sec) soundfile is recorded by the 8 microphones in .wav format and saved into an 8-channel wav-file. The .wav files are send from the Asus via ethernet to a NAS disc (network assisted storage) for storage. The NAS disc is located at 10m, inside the house.
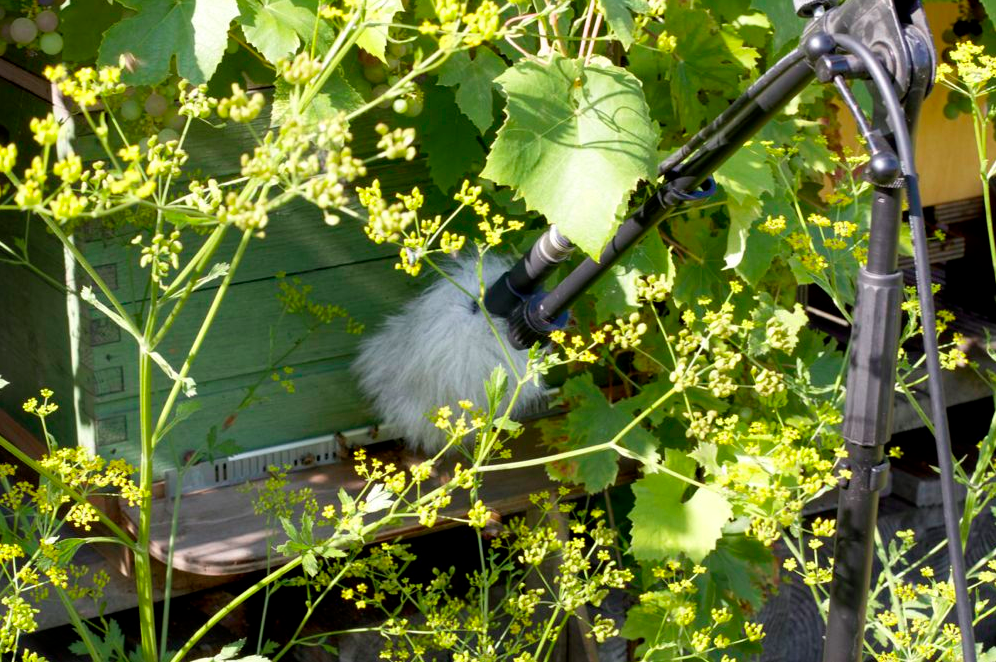
Since mid-august 2014 we have been adding a realtime audio streaming set up. We have been connecting a second 8-channel audio card (Focusrite) and 2 more electret microphones were placed at the entry next to the landing platform (to record the taking off of the forager bees, and to record the ventilation processes of the guard bees). We have been splitting the channels of the 4 existing electrets (in the rooftop), as well as 2 of the existing piezo's, and we've been connecting them to the new soundcard for streaming. For the new electrets mikes we've put 2 more pre-amps in the rooftop cover.
In total we stream 8 channels, but we can modify the setup at any time by disconnecting the channels that we don't want to stream.
The stream out of the soundcard is a USB which connects to the Raspberry from where we will send the audio+video stream.
VIDEO TOOLBOX
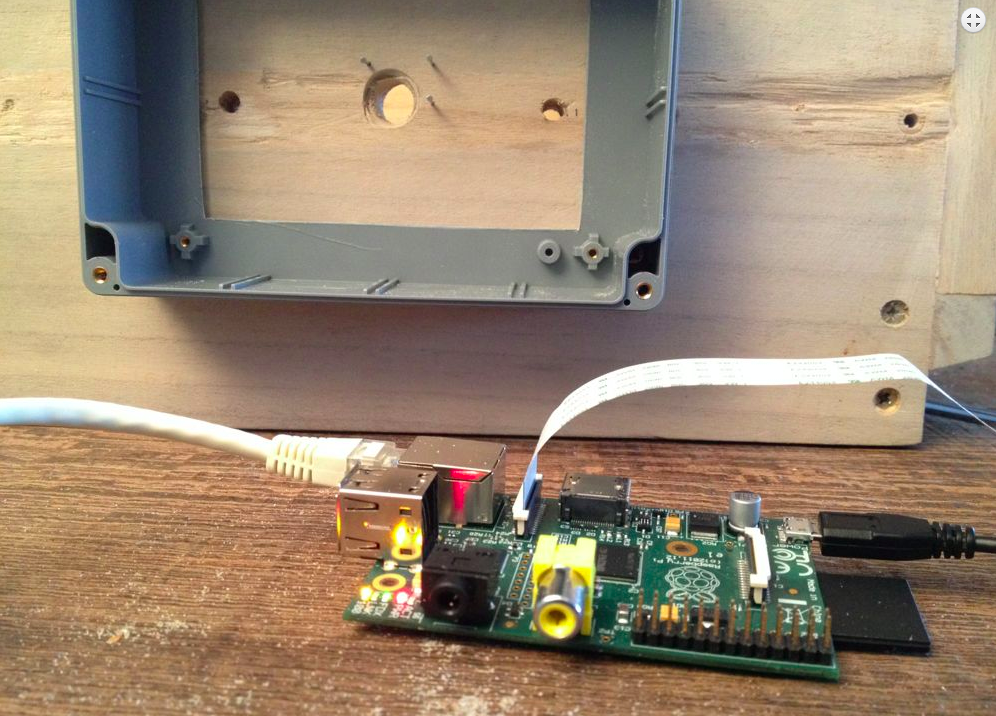
For the recording of the video images, we work with 2 Raspberry Pi computers. The Raspberry Pi is an ultra-low-cost card-sized Linux computer. The assets of the Raspberry are that the device can easily be build in complex installations and that is is equipped with a series of USB and ethernet connections to function in a network of devices. But the most important is that the Raspberry community developed their own full HD camera (size 25mm x 25mm) with (extra cost) replacable lenses.
The Raspberry Pi Camera Module is a custom designed add-on for Raspberry Pi. It attaches to Raspberry Pi by way of one of the two small sockets on the board upper surface. This interface uses the dedicated CSI interface, which was designed especially for interfacing to cameras. The CSI bus is capable of extremely high data rates, and it exclusively carries pixel data.
The board itself is tiny, at around 25mm x 20mm x 9mm. It also weighs just over 3g, making it perfect for mobile or other applications where size and weight are important. It connects to Raspberry Pi by way of a short ribbon cable. The camera is connected to the BCM2835 processor on the Pi via the CSI bus, a higher bandwidth link which carries pixel data from the camera back to the processor. This bus travels along the ribbon cable that attaches the camera board to the Pi. These qualities are extremely important when we work with a stream of video images. The sensor itself has a native resolution of 5 megapixel, and has a fixed focus lens onboard.
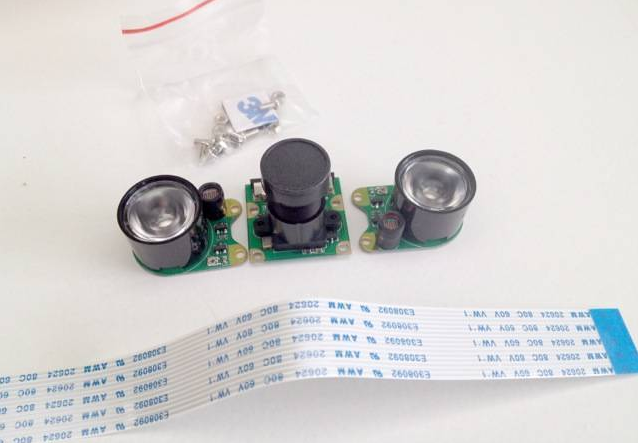
The Raspberry Pi NoIR Camera Board has no Infrared filter, which makes it perfect for taking Infrared photographs or photographing objects in low light or twilight) conditions. The camera plugs directly into the CSI connector on the Raspberry Pi. It's able to deliver clear 5MP resolution images, or 1080p HD video recording at 25fps.


We integrated 2 camera's in our setup as follows:
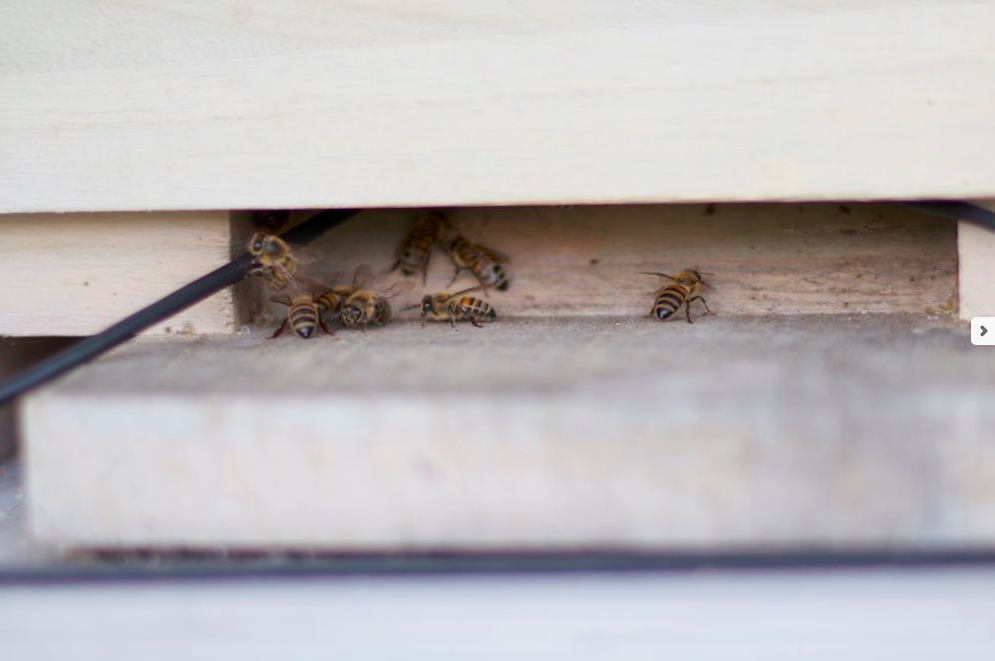
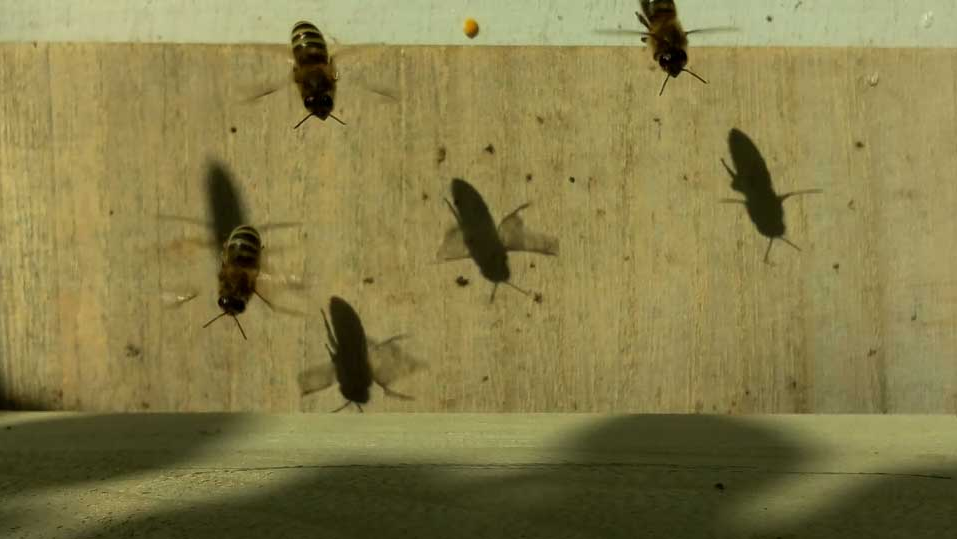
1) Raspberry Pi Hi Res camera (1920 x 1080 px) is mounted outside on the lower brood box and points in topshot to the landing platform.
The images can give information on:
i)relation to the environment (homing/pesticides, nectar supply, pollen supply)
ii)development of the colony (amount of forager bees activity, fanning bees, dead bees, lazy bees)
iii)health of the colony (exceptional conditions due to weather conditions/storms)
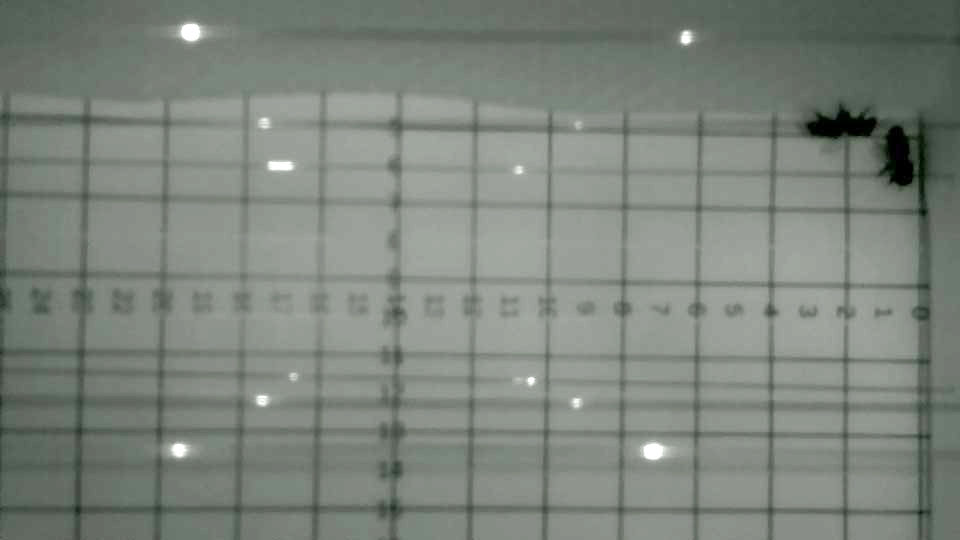
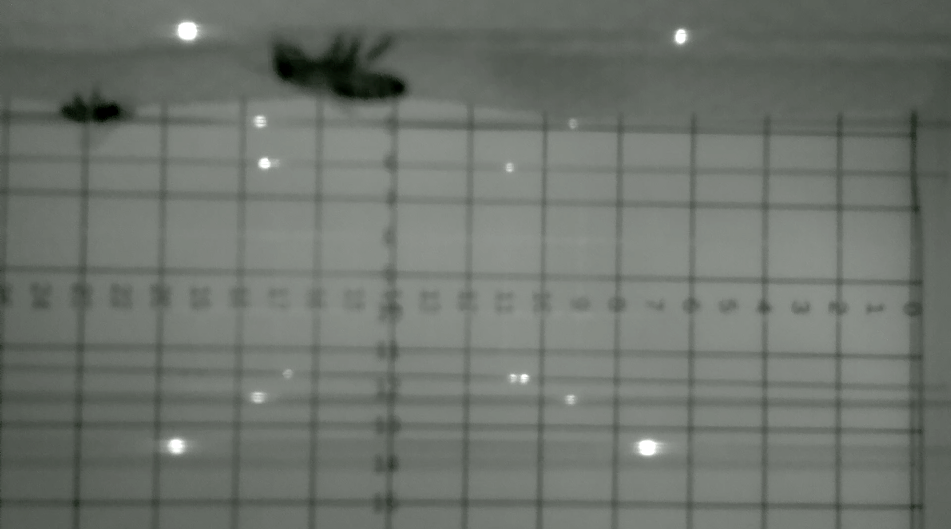
2) A second Raspberry Pi infrared camera 'PiNoir' - HiRes (1920 x 1080 px) is mounted at the side of the second brood box (see diagram) and records the activity inside the hive. The camera's objective is placed in a custom made little hole in the side of the box, facing into the dark box. The camera itself is connected to a Raspberry computer which is mounted into a waterproof box. 2 infrared led lights are connected to the camera. They light up following a custom written app at the same time as the video recordings.
We hacked the 2 fixed focus lenses to change focus from 'infinity' (factory setup) to 'custom focus'.
Outside we film the bees' activity from sundawn to sunset. To automize this schedule, we retrieve data based upon the timetable of the altitude of the sun and we integrate this code in our script. sun altitud. We synchronise the 2 Raspberry camera recordings with the (8) microphone recordings: every 15 minutes we record 3 minutes at 25 fps. This makes audio and video recordings of 12 minutes per hour.
We now have following setup (2014/06/03): a Warré beehive with 3 broodboxes. In the upper box we have 4 piezo transducers and 4 electret microphones, all connected by cables to an Asus computer and a Prosonus 8 channel-soundcard.
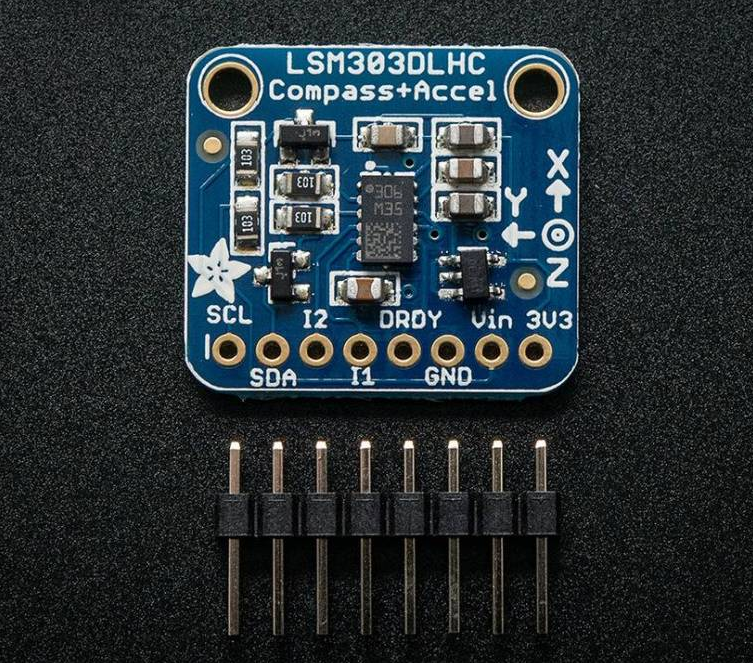
In the upper box we also introduced following sensors: a Phidget accelerometer and a Sparkfun combinet Temperature and Humidity sensor. The accelerometer is connected to one of the middle comb frames.
At the outside of the 2nd box (front) we have a PiCamera setup filming the flighthole and flightdeck.
At the side of the 2nd box, we have another PiCam (the PiNoir infrared camera) which is filming at the inside of the beehive the transit from the bees from the flighthole to the nest in the upper box.
All sensor data are updated once per second.
The microphones and the 2 cameras are synchronised and they all record 4 x 3 minutes/hour on the regular intervals of 00:00, 00:15, 00:30 and 00:45. All files are stored on the NAS (network assited storage).
We have a lot of problems (regular drop outs) with the alimentation (??) of the Raspberry Pi's. We install Watch Dog apps and other control tricks to avoid the stop of datastream, but nothing helps. Finally we install the 2 Raspberry camera's on a timer. This timer restarts both camera's between midnight and 1am, every day. We also order radiators for to be put on the processor. Maybe this will help?
We still had to solve the problem of the video codec extension. Videofile extension is now mp4 straight on the Raspberry and visible immediately on the NAS. When we download the file and upload it in the Pandora video database, it gets (finally) smoothly accepted and is transcoded and uploaded without problems.
To solve the blurry image problem with the PiNoir, we order a new PiCam with 6mm objective and new powerfull ledlights. This setup has still to be installed.
video toolbox notes
Video Monitoring of Honey Bee Colonies at the Hive Entrance
MORE SENSORS
Sensors inside the Beehives:
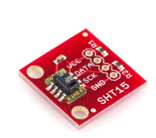
- Sparkfun combined temperature and humidity sensor SHT15;
- Sparkfun temperature sensor;
- Sparkfun humidity sensor;
- several temperature probes American Scientific;
I added a Sparkfun SHT15 t° and humidity sensor into the beehive. SHT15.
This is a simple breakout board for the SHT15 humidity sensor from Sensirion. The SHT15 digital humidity and temperature sensor is fully calibrated and offers high precision and excellent long-term stability at low cost. The digital CMOSens Technology integrates two sensors and readout circuitry on one single chip. The daily data are accessible online: dataset sound beehive.
Why t° and hu are so important in the hive: The average temperature in the beehive is between 32-35°C. Honeybees have the ability to regulate the temperature of their nest throughout the year. If it is cold, bees raise the temperature within the hive by huddling together to keep warm and vibrating their wing muscles to generate heat. If it is hot, they lower it by fanning their wings to circulate air through the hive. If it is really hot, they collect water for evaporative cooling. Droplets of water are placed inside the hive, then the bees stand in a line facing the hive entrance fanning their wings creating air currents that evaporate the water, thus cooling the hive. Whenever fanners are at the entrance, there are many inside the hive doing similar fanning to control the hive temperature.
Check also what Abbé Warré has to say about temperature, humidity and ventilation in the beehive. A Warre hive has a special ventilation approach.

Sensors outside the Beehives:
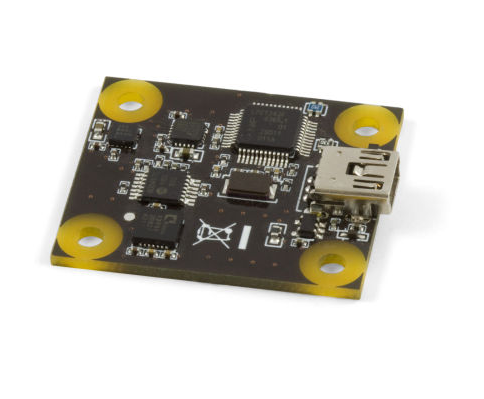
- Waspmote Libellium (Smart Agriculture Kit) including following environmental sensing devices: air temperature sensor, air humidity sensor, solar radiation sensor, soil humidity sensor, soil temperature sensor, leaf wetness sensor;
- Sparkfun combined temperature/humidity sensor SHT15;
The environmental data (with timestamp) of the garden are aggregated with the WASP (smart agriculture) module from Libelium. WASP dataset.
Vibration sensor:
Bees are very sensitive to vibrations on the waxcomb, this is one of their major means of communication inside the beehive. Therefore we decide to introduce an acellerometer to measure the vibrations of the wax comb in 3 axis. There a several possibilities:
The measurements of a regular accelerometer are problaby not detailed enough to sence and aggregate comb vibrations - which are very small vibrations. With Bart De Boer from the AI lab/VUB we decide to introduce a Phidgets accelerometer. The PhidgetSpatial Precision is a 3-axis accelerometer that can measure up to ±8 g of acceleration in each axis, and has high precision when measuring acceleration within ±2 g. This Phidget sensor covers exactly the frequencies in which Bart De Boer is interested for the bio-acoustic analysis. We add one of them to a comb-frame in the broodbox. Bart De Boer will integrate the code for this sensor asap.
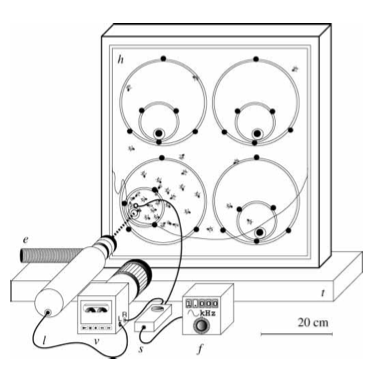
Vibrations as communication tool: Years after von Frisch interpreted the symbolism of the dances, Wenner and Esch independently found that dancing bees make sounds during their waggling run. Both men suggested that the sounds might help the dancer attract an audience in the dark nest. Many researchersdoubted this premise becausethey thought bees could not hear airborne sounds. Still, the notion was not ignored altogether. Many insects, including bees, are quite sensitive to vibrations. Hence, some investigators speculated that the sounds the foragers produced could vibrate the combs under their feet as they danced. The comb vibrations might then advertise the dance to those bees who could not otherwise see the forager.
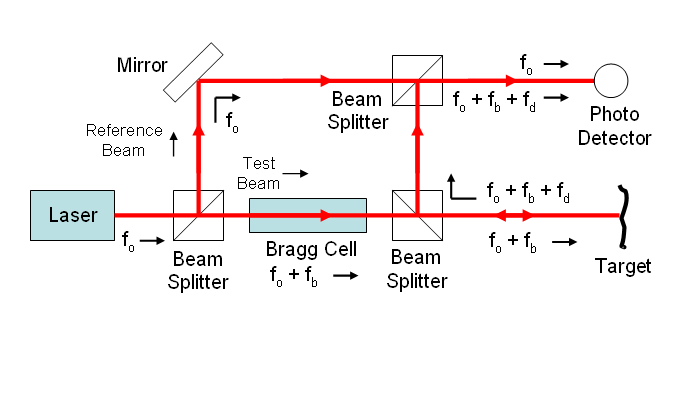
One of us (Kirchner), together with Axel Michelsen of Odense University in Denmark, answered part of this question several years ago. In their experiments, Michelsen and Kirchner aimed a laser beam at the comb near a dancing bee to determine whether or not the dance sounds generated vibrations in the comb. Surface vibrations, if any occurred, would cause minute changes in the light refiected from the comb. In this way, it was possible to measure the vibrations without touching the comb and possibly triggering additional tremors. These measurements revealed that dancing bees do not rattle the comb but that their audience does. The dance attenderssometimes emit a short squeak by pressing their thoraxes against the comb. This action vibrates the comb enough so that the dancing bee stops her movements. She then doles out small samples of the food she has collected so that her audience knows not only the direction and distance to the feeding site but how the food smells and tastes as well. vibration, communication and bee dances.
STORAGE AND ARCHIVING
We store the files on a NAS (network assisted storage) located on a safe place in the studio. The processed files are send from the 2 Raspberry Pi's and from the Asus computer over local network to the NAS.
Calculations for storage of sound files: 8 channel rec at 44.1 kHz amplerate, .wav format
| time format | number of takes | weight in Gb |
|---|---|---|
| take | 1 | 127 Mb |
| hour | 4 | 508 Mb |
| day | 96 | 11,9 Gb |
| week | 672 | 83,34 Gb |
| month | 2.920 | 363 Gb |
| year | 35.040 | 4.345 Gb |
Calculations for storage of video files from 2 camera's at HD (1920 x 1080).
The daily number of video files depends on the sunrise and sunset and is dynamically adjusted over the seasons.
To make a yearly calculation, we will take an average, starting 5am UTC and ending 7pm UTC (= 12 hours).
| time format | number of takes | weight in Gb | x 2 |
|---|---|---|---|
| take | 1 | 226 Mb | |
| hour | 4 | 904 Mb | |
| day | 48 | 10,6 Gb | 21.2 Gb |
| week | 336 | 74,2 Gb | 148.4 Gb |
| month | 1.440 | 323,3 Gb | 646,6 Gb |
| year | 17.520 | 3.880 Gb | 7760 Gb |
The disc space for video storage has to be doubled, as we record files from 2 camera's: the PiCam and the PiNoir.
The calculated daily average over the year is a mild average, knowing that 1 day folder on june 21 (longest day, 3am →20.30pm) weighs 32,2 Gb /day.
Transfer from the NAS to another archiving hard disc goes very slow. The folder of 1 day (= 2 camera's -at an average of 3,6 hours or 216 minutes each-) takes up to 4 hours per day folder transfer. But since I started transferring via ethernet cable (instead of wireless) and via a double speed switch, the transfer is much faster.
The sensordata from the temperature and humidity in the beehive are stored on http://opensensordata.net and are accessible in real time.
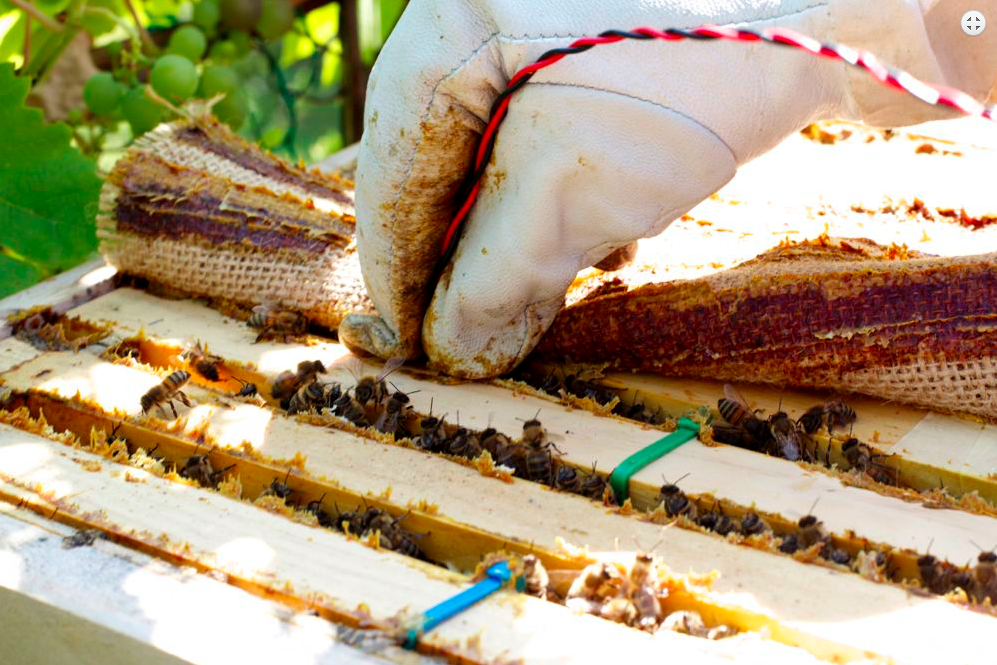
BRINGING IN THE BEES


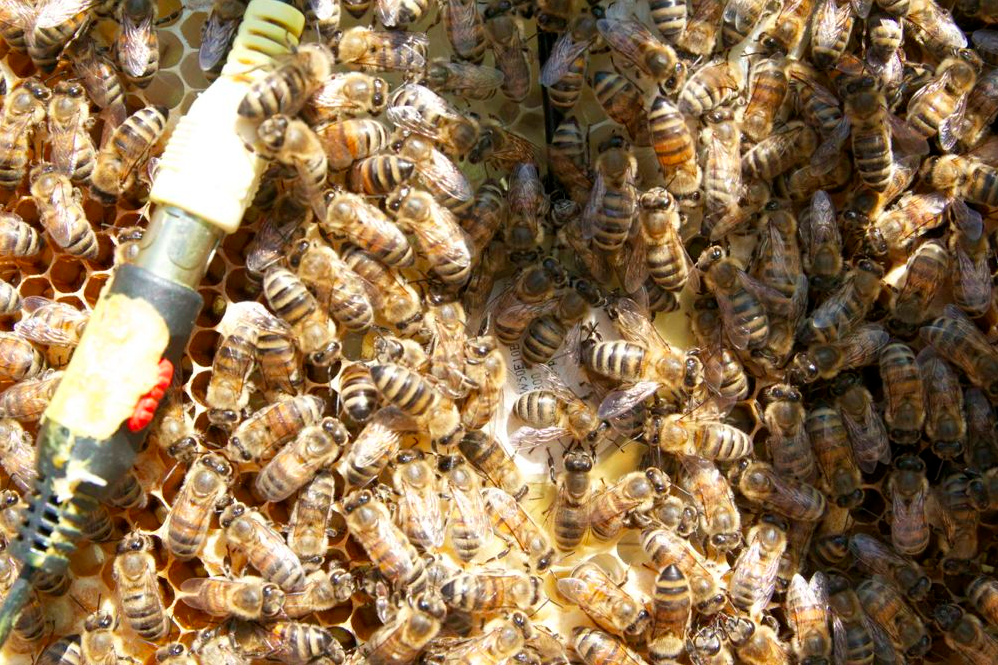
The new bees arrived on 10/06/2014.
Wednesday, june 11, the bees are inspecting their new environment. They do orientation flights around the beehive.
In the beginning, the very small colony has to be fed with extra food, as there are not yet enough foragers to support the colony in these moments (building comb) where they need high energy. Very soon, the colony will be independent and provide their own food storage.
http://pandora.okno.be/PE/editor/00:03:34,00:00:04.040,00:03:34 ⇒ filmed inside the beehive
http://pandora.okno.be/UA/editor/00:01:50.680,00:00:00,00:02:59 ⇒ filmed outside the beehive
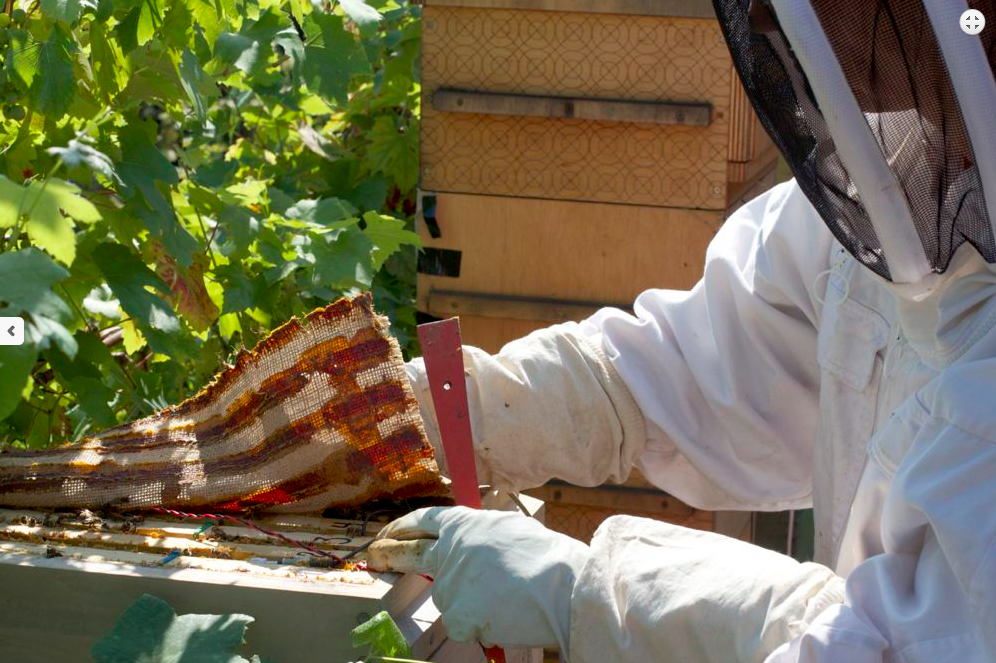
A month after their arrival, the colony is super well developed. The 6 middle frames are completely build out, and the 2 outer frames are nearly completed. The bees build wax around all piezo's. Piezo 8 (most right from standing behind the hive) is completely covered, as well as piezo's 6 and 7. Piezo 5 (utmost left) is half covered. I think that, in a week or 3, the bees will move downwards. Just enough time to improve our PiNoir camera setup.
Alltogether we can clearly observe that a honeybee colony in a Warré beehive develops at its own pace, which is slower than in a 'commercial' beehive as Dadant Blatt or Langstroth or Kempisch … The Warré is a good tool to observe & work towards a completely natural beehive - we'll check out what the season will bring further …
STREAMING
Since end of september we've steup a streaming camera connected to a Raspberry Pi computer. We are also streaming the sound of the 2 microphones at the entry of the beehive.
For the moment sound and video are displayed on 2 seperate channels in VLC. We'll try to make a monitor setup inside where the stream is continuously displayed, together with the audio.

Streaming the bees on 10th of december 2014, a sunny afternoon. The hive is packed in an extra pink layer, for winter.
}
BIO-ACOUSTIC SOUND ANALYSIS
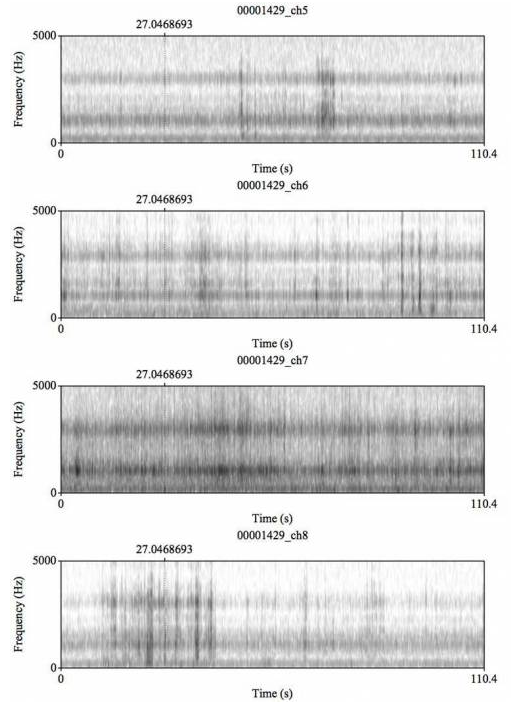
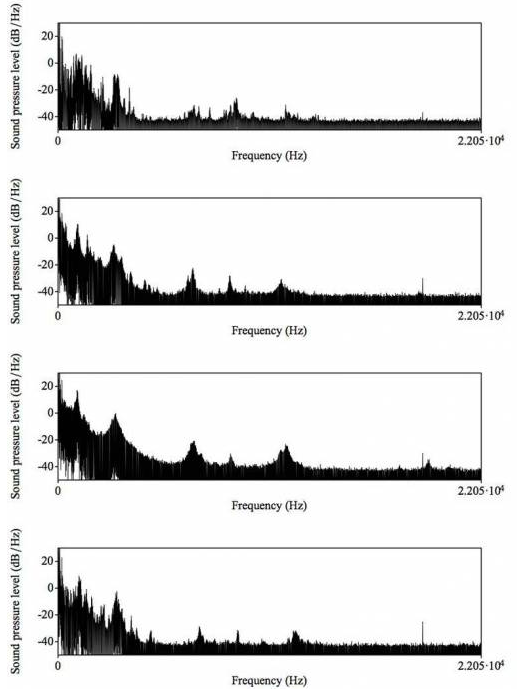

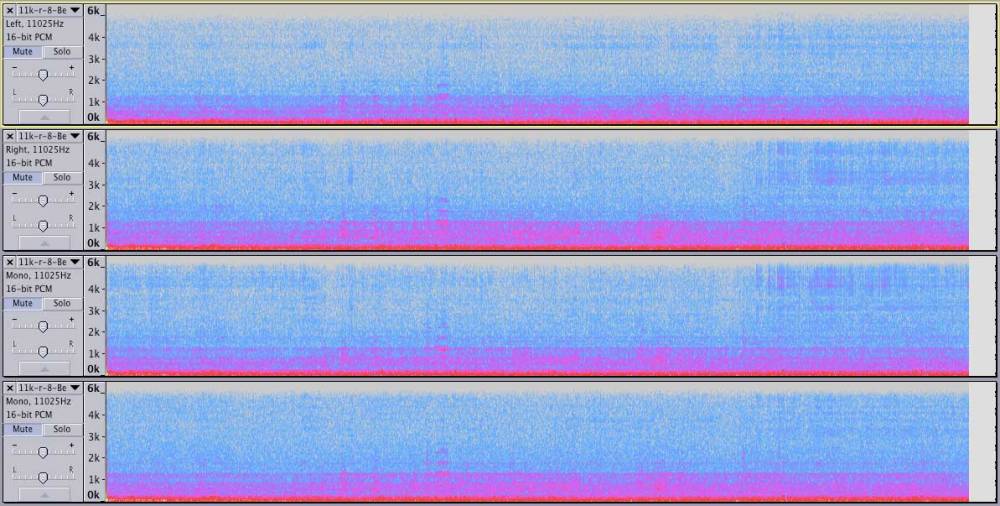
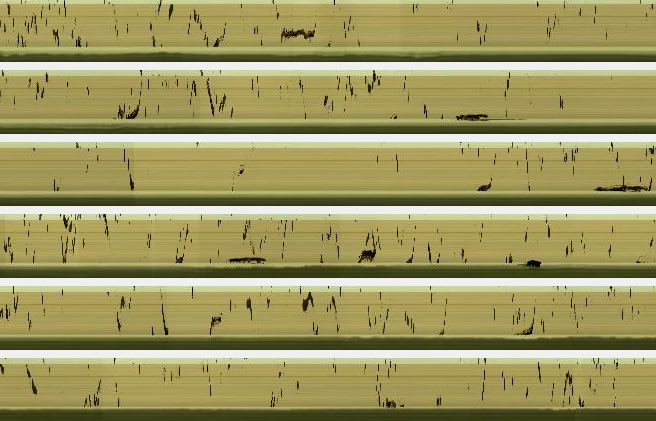
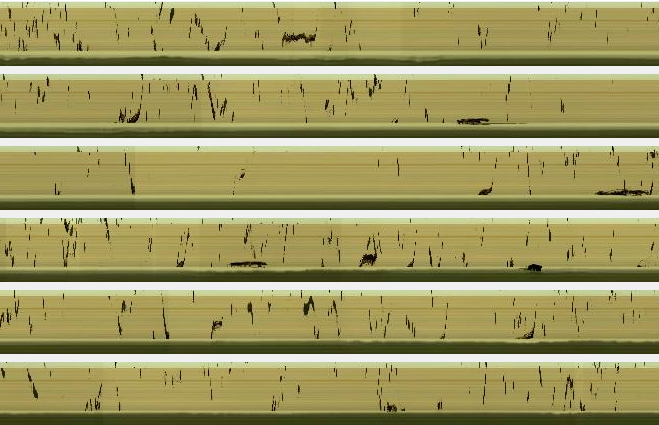
Spectrogram and timeslice analysis of a 4 channel.wav soundfile (of 4 piezo microphones placed into the broodbox of the sound beehive), 11 june 2014 at 12:00. The piezo contact microphones are still virgin, no wax is deposited by the bees.
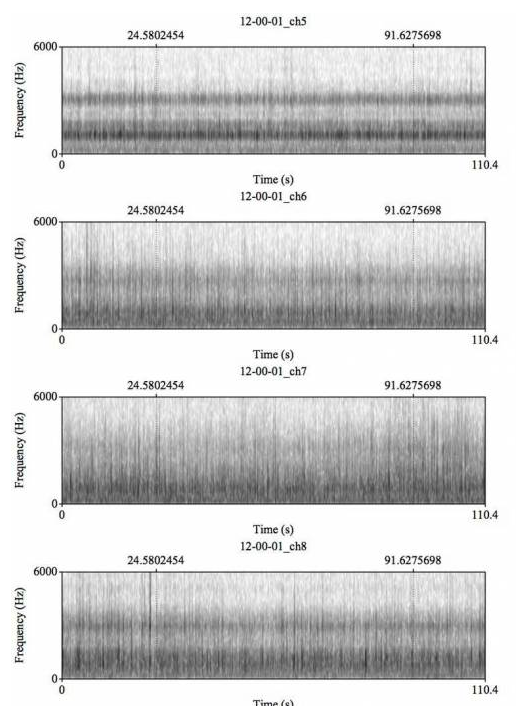
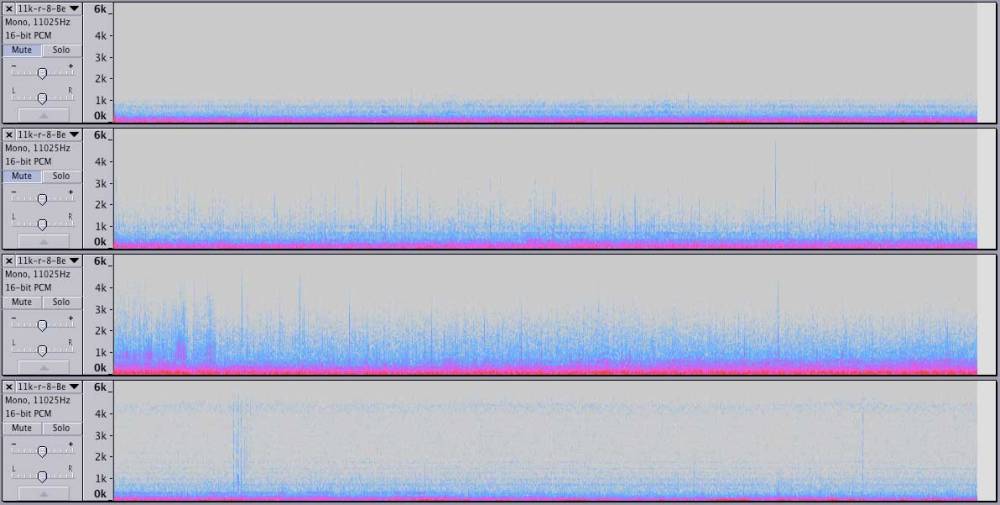
Analysis of a 4 channel.wav soundfile (of 4 piezo microphones placed into the broodbox of the sound beehive), 25 june 2014 at 12:00.
On the spectogram and timeslice images we see a clear difference. The images of channel 6 and 7 are much more rounded (no peaks), which means that the bees started building around these microphones (which are mounted into the frames of the same number). Over time, the image of the files will flatten out, as the bees build more and more wax around the microphones. Also the sound should become less sharp.
First we have the raw data (the 8 channel soundfiles). They have to be pre-processed (rendered more compact or 'cleaned') to extract 'features' which represent the 'problem'. The features are fed into a mathematical model (e.g. neural networks) with tweakable parameters lo learn the patterns. Herefore the model runs a learning algorithm to recognize the patterns and to tweak the parameters. Then the mathematical model is fed new data (a bit different, not absolutely the same) to learn new patterns, or to distinguish slightly different patterns. This is 'generalisation'. From time to time the model needs to be tested. Once the model is trained enough, it can start to do predictions.
Acoustic signals: an experienced observer can use animal sounds to recognize a “singing” animal species, its location and condition in nature. Investigation of animal sounds also includes signal recording with electronic recording equipment. Due to the wide range of signal properties and media they propagate through, specialized equipment may be required such as a laser vibrometer (substrate-borne vibrational signals). Computers are used for storing and analysis of recorded sounds. Specialized sound-editing software is used for describing and sorting signals according to their intensity, frequency, duration and other parameters.
For the analysis of the soundfiles (pattern recognition and machine learning) we collaborate with the AI laboratorium of the VUB (Free University of Brussels). Prof. Bart De Boer specialises in bio-acoustics.
Bioacoustics is a cross-disciplinary science that combines biology and acoustics. Usually it refers to the investigation of sound production, dispersion and reception in animals. This involves neurophysiological and anatomical basis of sound production and detection, and relation of acoustic signals to the medium they disperse through. The findings provide clues about the evolution of acoustic mechanisms, and from that, the evolution of animals that employ them. wikipedia bioacoustics.
For the analyses of the files, Bart De Boer will work with the PRAAT software. PRAAT.
PRAAT is an open source package. It is a computer program with which you can analyse, synthesize, and manipulate speech, and create high-quality pictures of spectograms and timeslices of the files.
Definition for 2 master thesis projects at the VUB-AI lab under supervision of Prof. Bart de Boer:
1) We have recently started recording large amounts of data from a beehive in Brussels in order to investigate whether we can detect patterns in this data that help us to both monitor the environment and the bee colony’s health. The aim of the research is twofold: to investigate whether we can use the bees as remote environmental sensors and to investigate whether, through monitoring the colony’s behavior, we can get advance warning of problems that may cause colony collapse.
In order to do this we need to solve a number of challenging computer science problems.
This project has the deceptively simple aim of counting the number of bees that pass through the image of a video camera that films the entrance of a bee hive. The number of bees that passes the entrance per unit time is an important indicator of the activity of a bee colony. The student is encouraged to solve this problem, for instance visual flow or feature-based approaches. However, it is important that the method is robust: it should work in any lighting condition (including ones where bees cast shadows) and even when bees collapse, or turn upside-down (which they do surprisingly often). The student should develop and fine tune their model using one subset of the available video recordings, and test its performance on different subsets. The performance will need to be compared to numbers established by counting manually.
2) A second project aims to investigate, using data mining and signal processing techniques in what way environmental data (temperature, humidity, time of day, environmental noise) relates to and predicts data recorded from within the hive (sounds and temperature). This is a challenging problem, as there are large amounts of real-world noisy data, in which the patterns may not be stable over time (after all the bees’ behavior changes with the season).
The student will need to apply signal processing techniques (these can be from a library) to mine for patterns selection of the recordings. Any techniques may be used here, but statistical machine learning techniques are probably most promising. When candidate patterns are found, these need to be tested with different selections of the recording in order to prevent spurious patterns from being found.
paper: Robust Sound Source Localization Using a Microphone Array on a Mobile Robot
bio-acoustic sound analysis
FEATURES & SOUNDS RELATED TO THE BEHAVIOUR OF THE COLONY
notice and prevent:
waxmoth: observation & warning
swarming: sounds, action, more drones
stress level: activity, bearding, temperature related
study of the collective behaviour
A superorganism is an organism consisting of many organisms. This is usually meant to be a social unit of eusocial animals, where division of labour is highly specialised and where individuals are not able to survive by themselves for extended periods of time.
The technical definition of a superorganism is “a collection of agents which can act in concert to produce phenomena governed by the collective, phenomena being any activity “the hive wants”, such as bees choosing a new nest site.
http://en.wikipedia.org/wiki/Superorganism
http://zool33.uni-graz.at/artlife/bee
hive temperature
accurate temperature inside hive: moving of the bee-blob/nucleus inside of the hive (very important in winter - heath camera? calculating the hue values of pixels on webcam images?) thermographic camera heath sensitive camera to spot the 'heather bees'
pheromone based activity
- pheromones (alarm, brood, stress, drones)
- pheromones (queen)
- antennae (vibrations)
vibration based communication
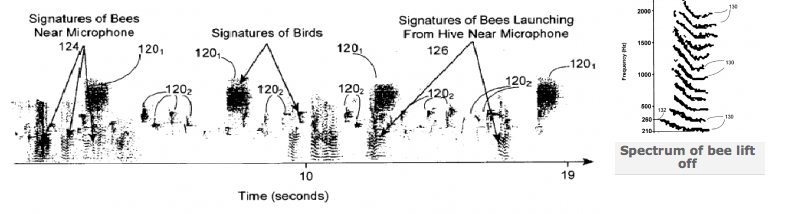
Early signs of swarming can be detected by making sound recordings and analyse them later on a PC using Audacity or other software for spectrum analysis.
If you want to build a real-time spectrum device,consider an arrangement of analogue filter banks, comparators and LEDs. The dominant frequency is approximately 220-240Hz followed by the first harmonic at 440 – 480Hz. According to literature this corresponds to the wing-beat frequency which varies depending on whether the bee is flying or stationary. Moreover, accordingly to unconfirmed reports, a newly hatched bee will have a higher wing-beat frequency due to incomplete forming of the wings.
Queen piping is an interesting sound; some of the recordings place in the 400Hz – 4KHz range. Sounding much like a duck.
http://www.beehacker.com/wp/?p=240#comments
waggle and other dances to communicate
In the hive the steps and waggles of a successful forager correlate closely with the exact distance and direction from the nest to the resource she has discovered. For the next two decades, most scientists believed bees relied primarily on these silent movements to communicate. In the 1960s this view was challenged in two ways.discovered that the dances were not silent after all. As the bees dance, they emit faint low-frequency sounds, and researchers [Wenner and Esch] suggested that the sounds might play a critical role in the bees' communication. The use of sounds, they reasoned, might account for the bees' ability to communicate effectively in the complete darkness that prevails inside their nests.
bee dance
study of the bee microbiome
http://www.plosone.org/article/info%3Adoi%2F10.1371%2Fjournal.pone.0095056
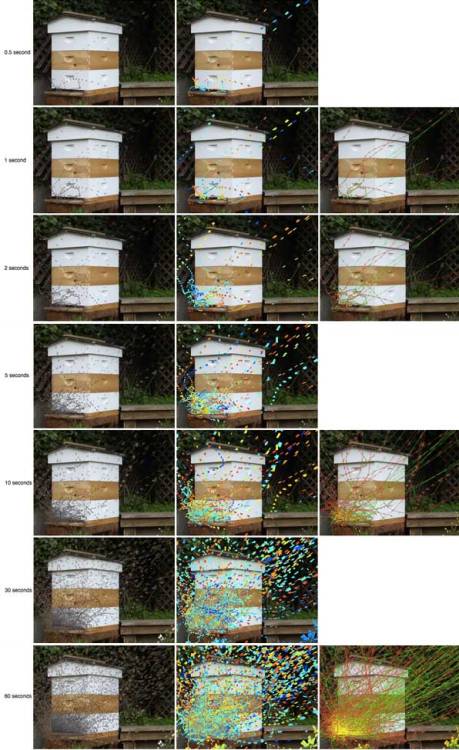
PROCESSING THE DATA: FROM POINT TO LINE TO CLOUD
[click image to play video]
Left: Bees hovering over the landing platform during their orientation flights. Right: Bees building their nest inside the hive.
SBH-presentation front and rear — flock of bees on a frame [video]

sensordata, display in box - temperature, humidity, light
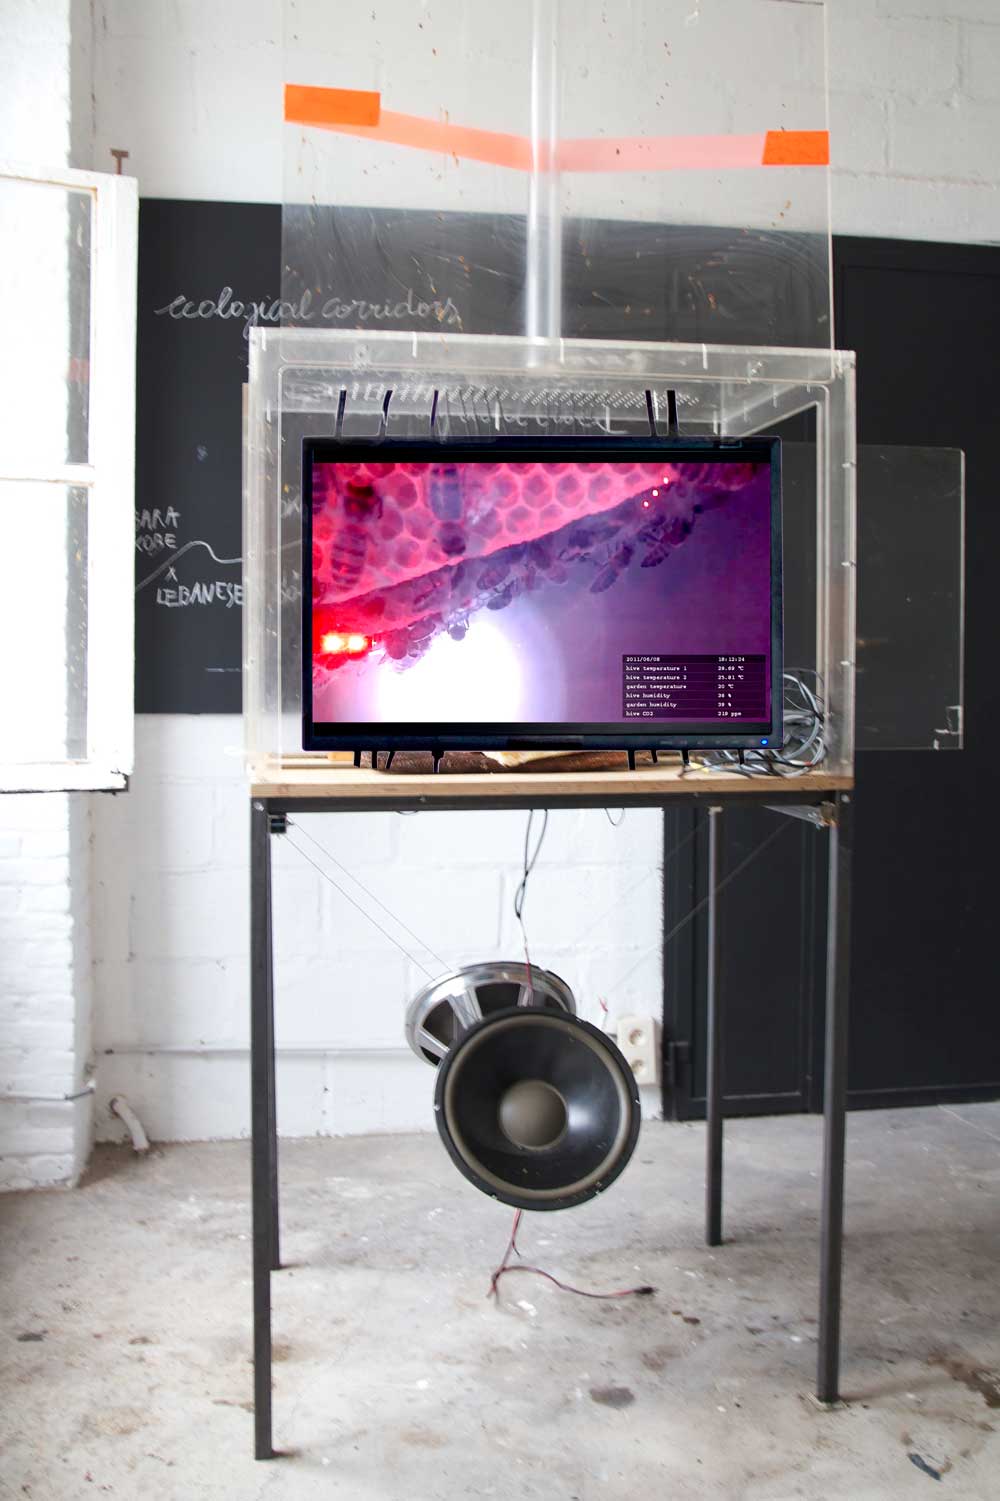
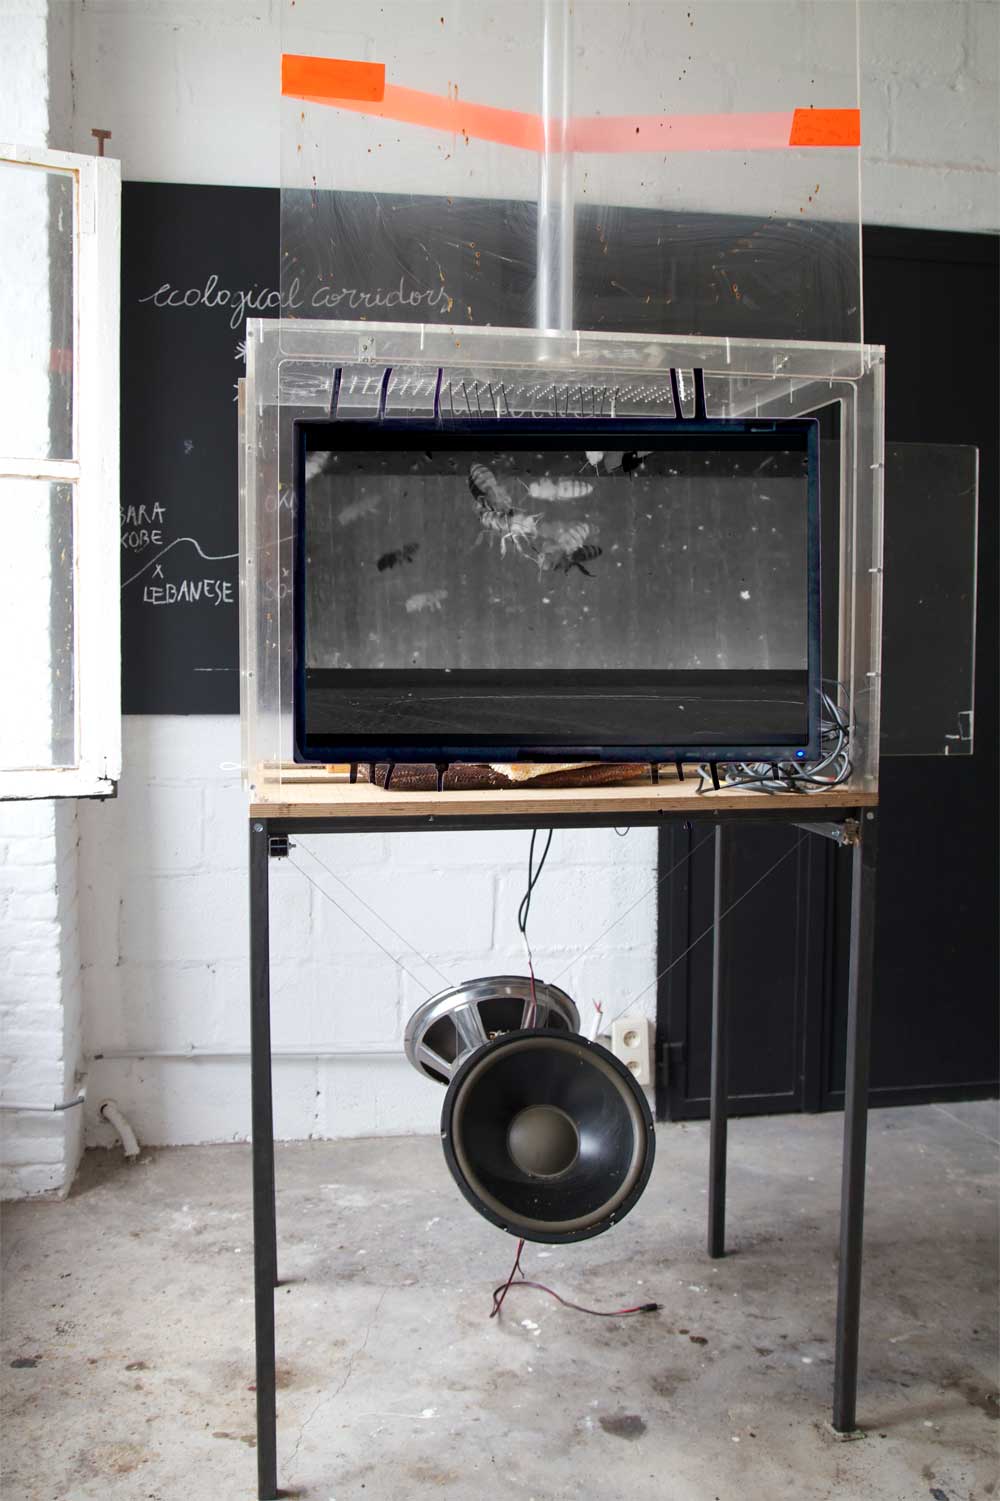
The research findings of the sound beehive experiment can be presented as follows:
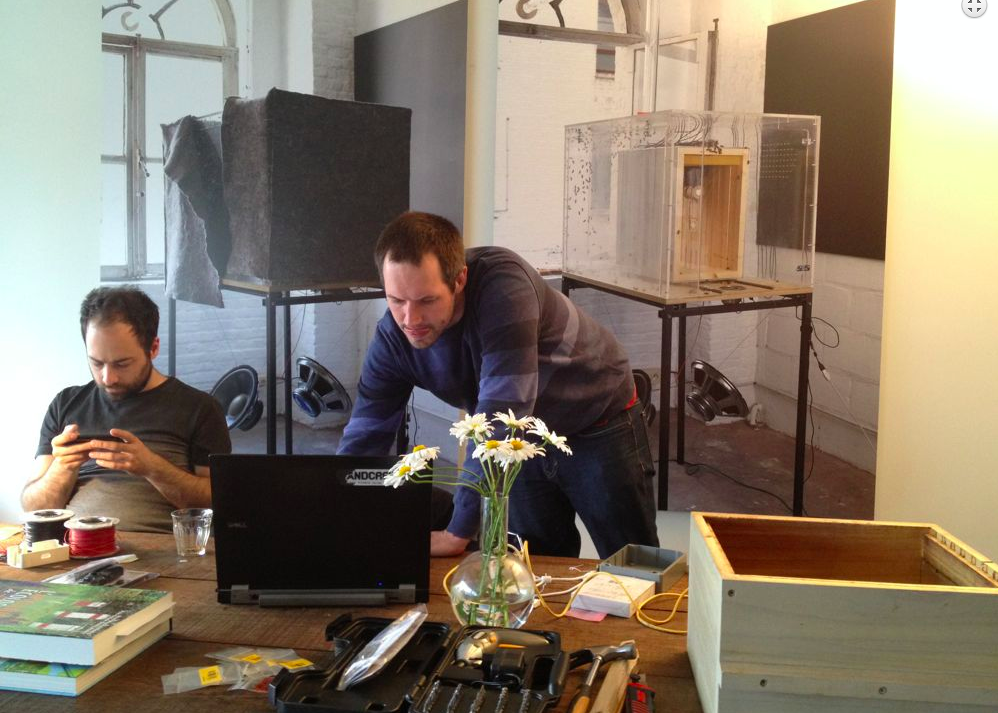
2 TFT flatscreens in the plexiglass cage of the Transparent Beehive.
1 screen (black bees) presents in realtime streaming the blackbees filmed on the landing platform of the sound beehive in the Brussels rooftop garden apiary.
The other screen (red bees) runs the 11h:35min movie of 1 year of bee monitoring (2012) inside the beehive, related to the sensor data as t°, Hu and Co2 inside the hive and outside in the garden.
The sound is also realtime, streaming from the setup of the sound beehive in the Brussels rooftop garden (8 channel soundfile).
We can make an additional plexi showcase for presenting the findings of the experiment and for display of information and equipment.
Analyse and recode the video images:
- analyse stills
- analyse tekst, data – other input
- relationship between the outside t° and the inside t° and the behaviour of the bees
- relation between the changing light density (solar radiation but also based upon images' luminance) frequency and the bee activity
- swarm algorithms and wax telephone lines
- position in the image (bees)
- position in the garden (GPS OpenGreens)
- enlarge the image (or part of the image) to maximum resolution and scan each pixel’s brightness
- change brightness of pixels in realtime according available realtime data info
- the higher the — the faster the — or other relations between realtime signals
- render the invisible space of data flows, give it a structure, poetics and politics.
BEE ACTIVITY RELATED TO THE ENVIRONMENT
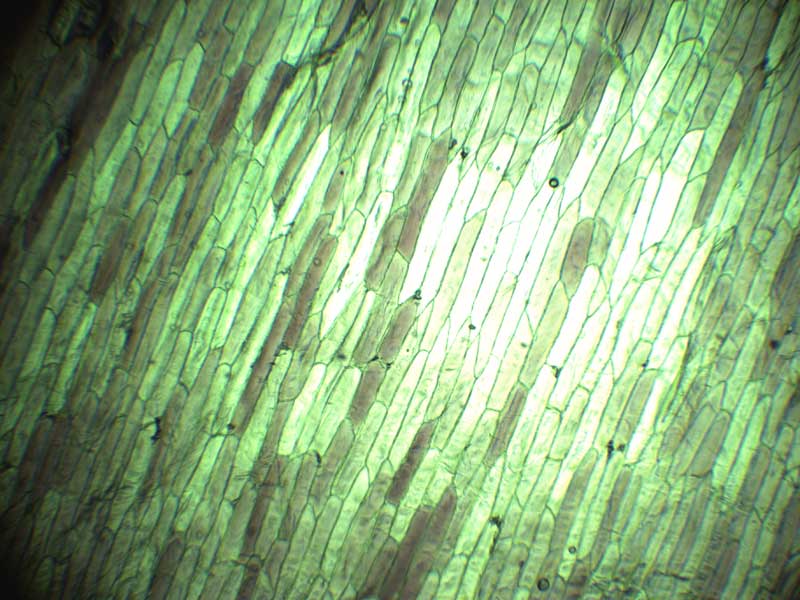
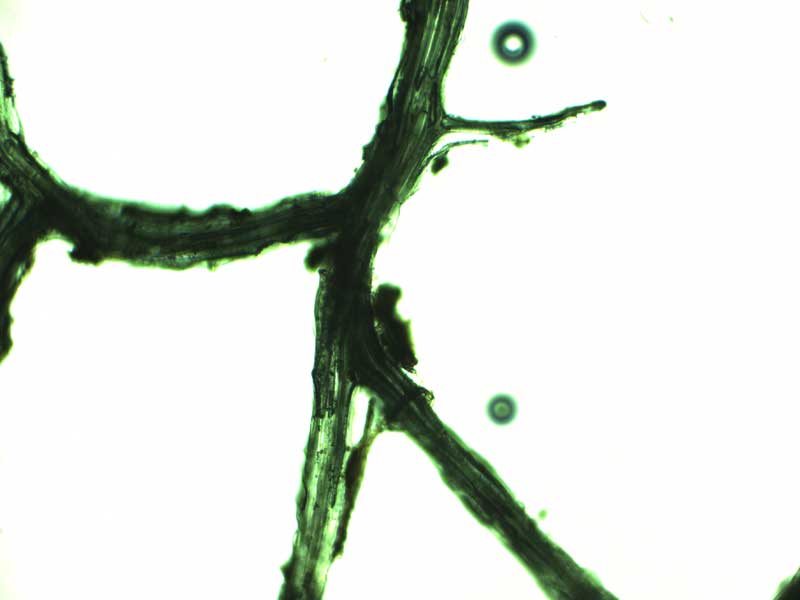
study of plants after bee pollination
mapping of the Foraging Areas
Visualize the flightroutes of the bees in their foraging fields. Research the emerging green corridors in the city, connected by the bee colonies.
RFID chips
grant for bee tracking
define degree of air pollution
Because bees carry an electrostatic charge, and can attract other particles, the same techniques of melissopalynology can be used in area environmental studies of radioactive particles, dust or particulate pollution.
http://en.wikipedia.org/wiki/Honey
measure the hours of solar activity related to nectar flow
Nectar secretion increases as the flower is visited by pollinators. After pollination, the nectar is frequently reabsorbed into the plant.
The prediction of when flowers bloom (nectar flows) is more accurately estimated by counting the number of sun-days than by looking on a calendar. Solar activity also indicates how many days bees have available to forage for honey. Also the soil composition might be important for the amount of nectar flow.
WASP-data/solarradiation
http://en.wikipedia.org/wiki/Nectar
honey & pollen analysis
http://en.wikipedia.org/wiki/Melissopalynology
http://en.wikipedia.org/wiki/Pollen
pollen, electron microscopecorridorstracing flightroutes
Melissopalynology is the study of pollen contained in honey and, in particular, the pollen's source. By studying the pollen in a sample of honey, it is possible to gain evidence of the geographical location and genus of the plants that the honey bees visited, although honey may also contain airborne pollens from anemophilous plants, spores, and dust due to attraction by the electrostatic charge of bees.
MEDIA ECOLOGY THEORY
Jussi Parikka
has published very widely on digital culture, archives and visual culture, network society and media theory. His work on media archaeology has gathered wide international attention and awards. http://jussiparikka.net/
They are everywhere and they can be perceived as quite the alien intelligence; six-legged, with their numerous eyes, capacities of motion and sensation so different from our own. No wonder science fiction has been inspired by insects. But also other fields, like robotics as well as network design. Insects are more than creepy-crawly bugs; they are also a central reference point of so much of network culture, from talk of hive minds and distributed networks to algorithms that function like ant colonies; some refer to our cognitive capitalist practices as “pollen society”.Insect Media: an Archaeology of Animals and Technology
Jake Kosek
Ecologies of Empire: On the New Uses of the Honeybee
This essay examines the rise of the honeybee as a tool and metaphor in the U.S. “war on terror.” At present, the largest source of funding for apiary research comes from the U.S. military as part of efforts to remake entomology in an age of empire. This funding seeks to make new generations of bees sensitive to specific chemical traces—everything from plastic explosives, to the tritium used in nuclear weapons development, to land mines. Moreover, in an explicit attempt to redesign modern battlefield techniques, the Pentagon has returned to the form and metaphor of the “swarm” to combat what it takes to be the unpredictability of the enemy in the war on terror. At the same time, honeybee colonies are collapsing. Rethinking material assemblages of bees and humans in the war on terror, this essay moves beyond the constrained logic and limited politics of many epidemiological investigations of colony collapse. Honeybees are situated within a more expansive understanding of the role of and consequences for the animal in modern empire building.
interview with Jake Kosek by the futurefarmers
Josephine Berry Slater
Mute Magazine: disorder/colony/collapse
editorial Metamute
Armin Medosch has been awarded the degree of PhD at Goldsmiths, University of London, for a a practice-based PhD in Arts and Computational Technology (ACT) at Digital Studios, with Prof. Janis Jefferies.
http://www.thenextlayer.org/
http://www.field2field.com/