bio-acoustic sound analysis
On 25/05/2014, walking back from the voting office, a discussion with Joeri learns me this:
First you have raw data (the 8 channel soundfiles). They have to be pre-processed (rendered more compact or 'cleaned') to extract 'features' which represent the 'problem'. The features are fed into a mathematical model (e.g. neural networks) with tweakable parameters lo learn the patterns. Herefore the model runs a learning algorithm to recognize the patterns and to tweak the parameters. Then the mathematical model is fed new data (a bit different, not absolutely the same) to learn new patterns, or to distinguish slightly different patterns. This is 'generalisation'. From time to time the model needs to be tested (e.g. picture of the dog).
Once the model is trained enough, it can start to do predictions.
21/05/2014
Meeting with Bart De Boer from the VUB (Brussels' University) Artificial Intelligence Lab.
I will collaborate with Bart for analyzing the sound files. Later we will also set up a monitored beehive at the VUB Artificial Intelligence Lab. I explain the setup to Bart, who works in bio acoustics.
Bioacoustics is a cross-disciplinary science that combines biology and acoustics. Usually it refers to the investigation of sound production, dispersion and reception in animals (including humans).[1] This involves neurophysiological and anatomical basis of sound production and detection, and relation of acoustic signals to the medium they disperse through. The findings provide clues about the evolution of acoustic mechanisms, and from that, the evolution of animals that employ them. bioacoustics.
Acoustic signals: an experienced observer can use animal sounds to recognize a “singing” animal species, its location and condition in nature. Investigation of animal sounds also includes signal recording with electronic recording equipment. Due to the wide range of signal properties and media they propagate through, specialized equipment may be required such as a laser vibrometer (substrate-borne vibrational signals). Computers are used for storing and analysis of recorded sounds. Specialized sound-editing software is used for describing and sorting signals according to their intensity, frequency, duration and other parameters.
I show the technical set up as far: 4 piezo microphones mounted on the frames of the Warre beehive and 4 electret microphones integrated in the 4 corners of the beehive's rooftop. The rooftop also hosts the pre-amplifiers for all microphones. The whole is connected by an 8 channel audiocable towards the improvised sound lab (previous the sauna shower) where it is connected to a Prosonus sound card and an Asus micro computer with a Debian operating system.
Bart has some questions on the dynamic range of the microphones, the low frequency-range. Which pre-amplifiers to use to have the less distortion possible, to avoid the noise to a maximum. Same remark for the sound card. We need to check the tech specs. He can always work with a low noise application.
For the analyses, he will work with the PRAAT software. PRAAT.
PRAAT is an open source package. It is a computer program with which you can analyse, synthesize, and manipulate speech, and create high-quality pictures of spectograms and timeslices of the files.
The bee colony was introduced into the hive on june 10 2014, around 17:30pm.
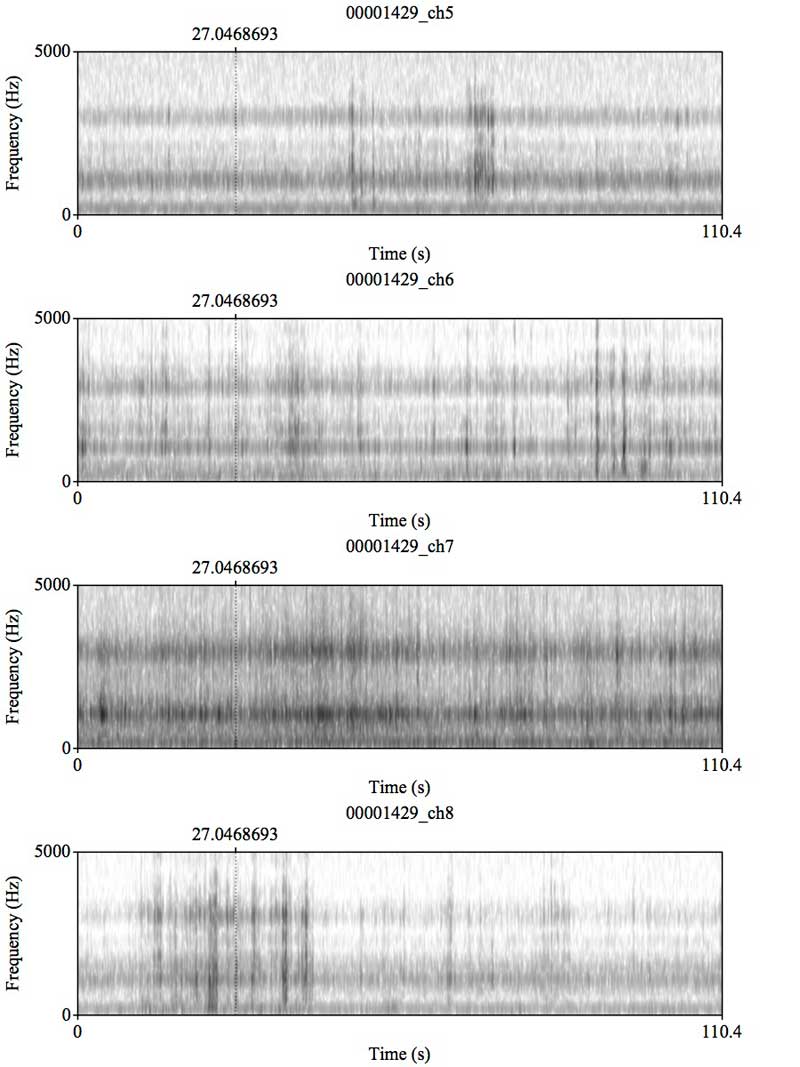
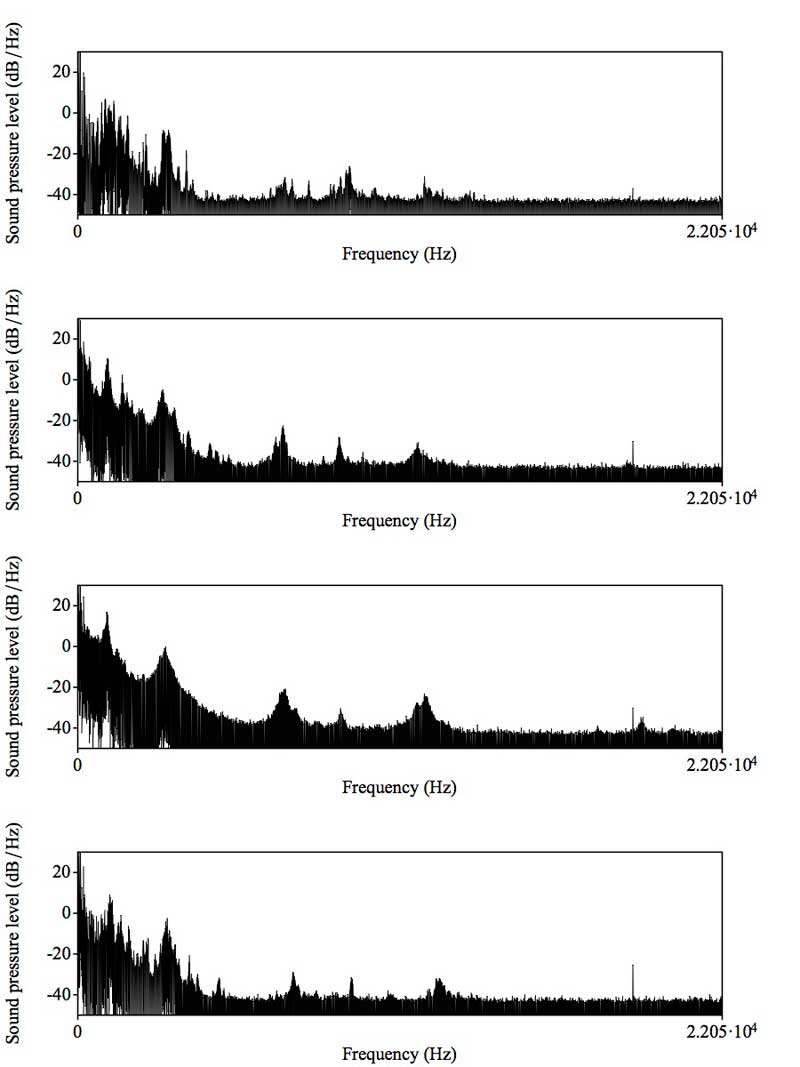
Spectogram and timeslice analysis of a 4 channel.wav soundfile (of 4 piezo microphones placed into the broodbox of the sound beehive), 11 june 2014 at 12:00. The piezo contact microphones are still virgin, no wax is deposited by the bees.
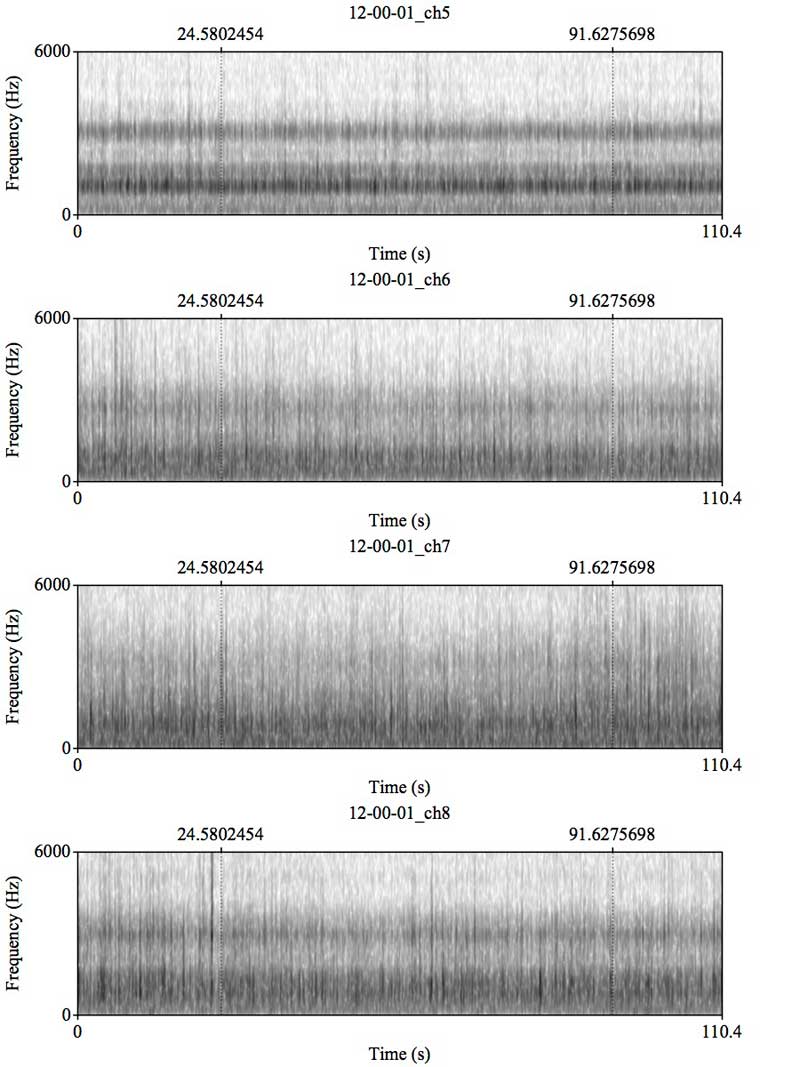

Analysis of a 4 channel.wav soundfile (of 4 piezo microphones placed into the broodbox of the sound beehive), 25 june 2014 at 12:00.
On the spectogram and timeslice images we see a clear difference. The images of channel 6 and 7 are much more rounded (no peaks), which means that the bees started building around these microphones (which are mounted into the frames of the same number).
Over time, the image of the files will flatten out, as the bees build more and more wax around the microphones. Also the sound should become less sharp.
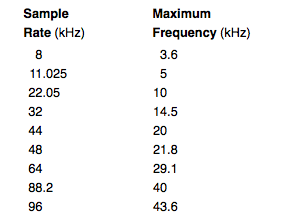
http://wiki.audacityteam.org/wiki/Sample_Rates
Nu zitten we op ongeveer -20dB. Ideaal zou -10dB zijn, dan hebben we luidere opnames en nog genoeg “headroom” voor als het regent of stormt.
Actual Sampling Rate = 44,1 KHz ⇒ this is overkill.
Sampling rate 11,025kHz / Frequency kHz 5 zou meer dan voldoende zijn.
(Spectogram range van de bee-sounds is tot ± 5000 kHz, een verdubbeling volgens Nyquist theorem geeft ± 10.000 Hz.)
End of june 2014, Prof. Bart de Boer writes 2 propositions for thesis students in AI, working on a bee counter starting from the analysis of our video images, and another proposition for students intrested in working on pattern recognition in the sound files.
thesis propositions for bee-files analysis
Experimental Behavorial Ecology and Sociabiology (Hölldobler and Lindauer, 1985):
Different races of honey bees communicate in different dialects. Von Frish suggested this is related to the range of their foraging areas. The south european bees communicate with a 'shorter' dialect and the bees from temperate climates have a 'longer' dialect. The acoustic signals have 3 physical dimensions:
- frequency
- intensity of the individual frequency components
- temporal structures of sound.
Acoustic Analysis of Bee Behavior:
http://www.beehacker.com/wp/?page_id=103
Acoustic Analysis of Bee Behavior: on frequencies
http://www.beehacker.com/wp/?p=240
the Apidictor: was invented, patented, and marketed by the late Eddie F. Woods in the 1960s. He based it on the following insights into the lives of the bees (continue …). Mr. Woods claimed that he could predict the swarming of the colony. Therefore he used the apidictor. Apdictor pdf
“Sound engineers are familiar with a phenomenon known as the ‘cocktail party effect’. This is the ability of the human brain, in a room full of chattering people, to pick out and concentrate on one conversation, not necessarily the loudest. Eddie was blessed with this ability and it served him well when listening to the medley of sounds that his microphone picked up in the hive.
One sound that caught his attention was a sort of warbling noise that varied between the notes A and C sharp; that’s 225 – 285 Hz in terms of frequency. He noticed that this sound got steadily louder, then it stopped and a day or so later a swarm took off.
Eventually, he decided that it was made by the 4-1/2 to 6 day old nurse bees, his reasoning being as follows:
In a normal colony there are about 4,000 nurse bees, half of which feed the brood and the other half, the queen, who eats 20 times her own weight in a day…“ apidictor

research: a new apidictor?
The research was published online on February 5, 2011 in the journal Computers and Electronics in Agriculture.
The paper explains how a research team at Nottingham Trent University has developed a hi-tech method of using accelerometers to detect and translate the vibrations caused by bees as they communicate with one another in a hive.