This is an old revision of the document!
Table of Contents
Data Visualization
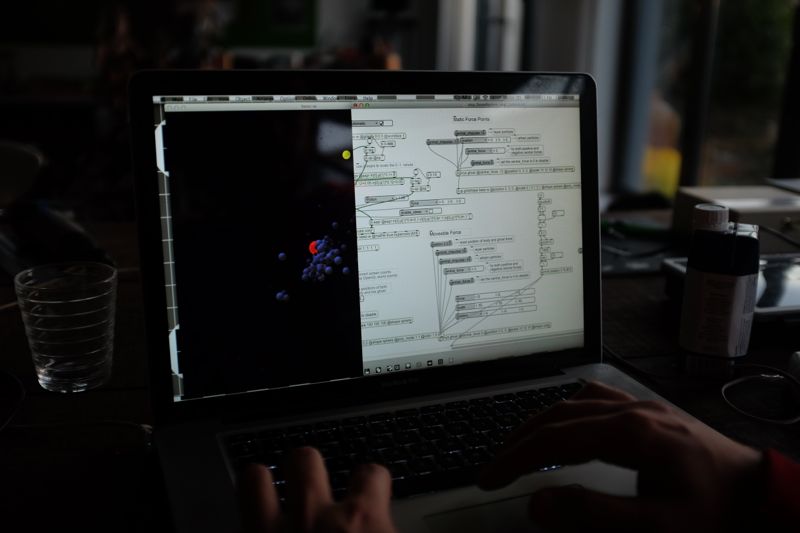
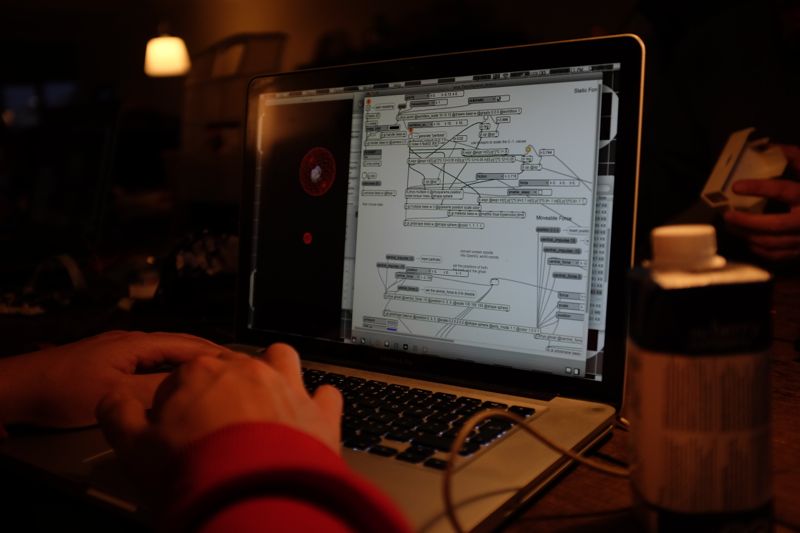
visualizations in Max/MSP - Jitter (open GL)
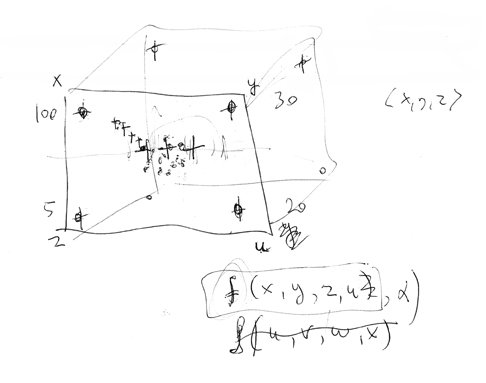
A given 3D space with a colony of virtual bees (little spheres variable quantity 10.000/50.000).
Sensordata - audio, video, environmental data inside/outside the hive - are all time-stretched to have regular time segments.
E.g. environmental data values are every 10 seconds ⇒ these are timestretched to fit the audio and video which is at 24 fps.
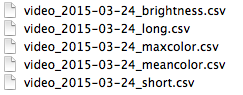
All data are converted to txt (cvs).
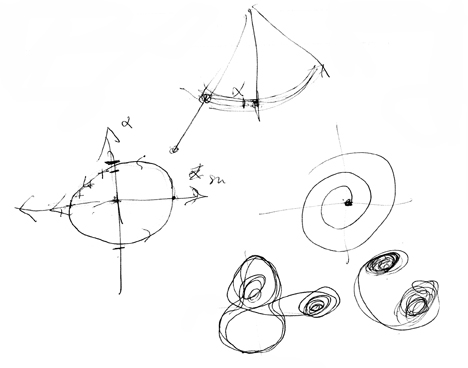
Different parameters (temperature, humidity and hours of sunlight or rain, but also the frequencies and amplitudes of the soundfiles, the amount of action (bees) in the video files) will act as strange attractors in the 3D space and they will influence the behaviour of the virtual bee colony (bee-blob) in space, but also in volume or condensation.
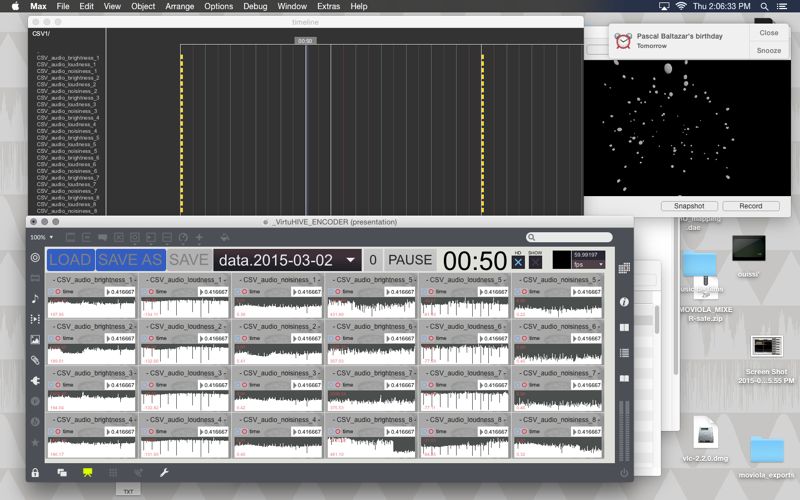
Monday 12/1/15 we start the analyses. We first work with the frequency and the amplitude of the soundfiles. In Maxmsp we analyse the files on their brightness, loudness and noisiness. We add a bandpassfilter on the files of the electret microphones, as there are plenty of disturbing external noises around the beehive (people talking, birds singing, wind, …). Than we take only 1 minute of the file (instead of 3 minutes), that way we can eliminate the sound of the churchbell's of Ste Catherine (every hour!).
Once the soundfiles are analysed, they are exported in a logfile in cvs-format, similar to the logs of the sensor-data. The time-interval of the sensordata is once every 15 minutes (for temperature and humidity inside the beehive, as well as for the environmental temperature, humidity, lightconditions). The consecutive values are stretched and interpolated every 15 minutes. Thus the final storage of sound and sensorinformation has a similar time-format.
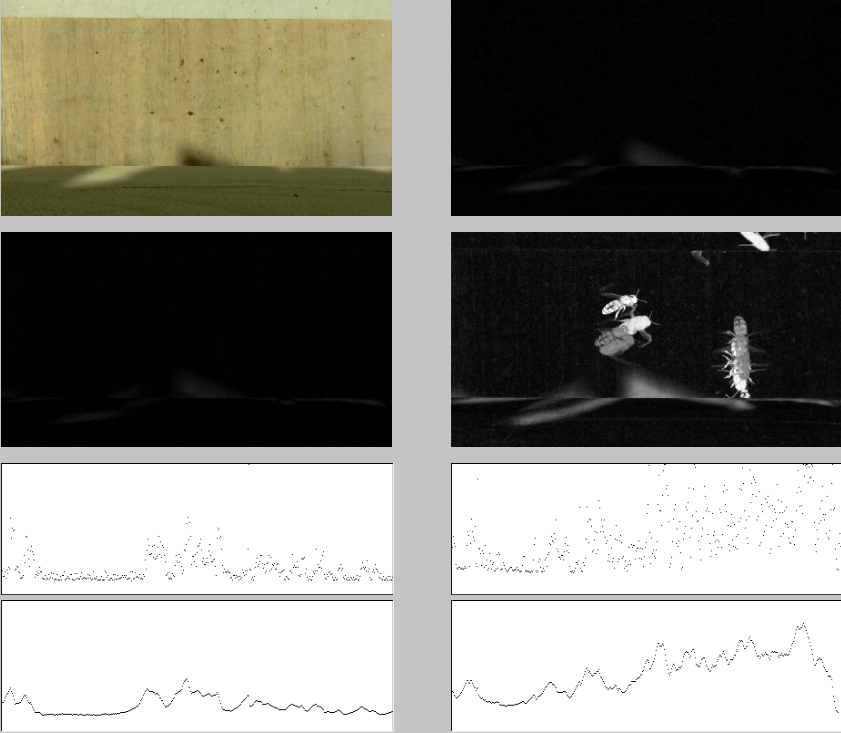
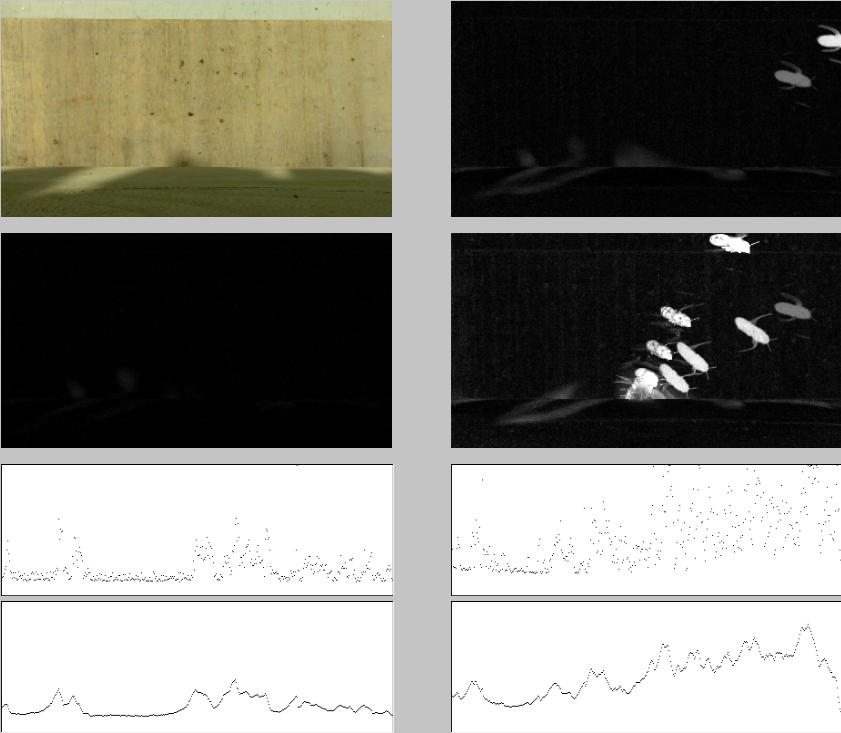
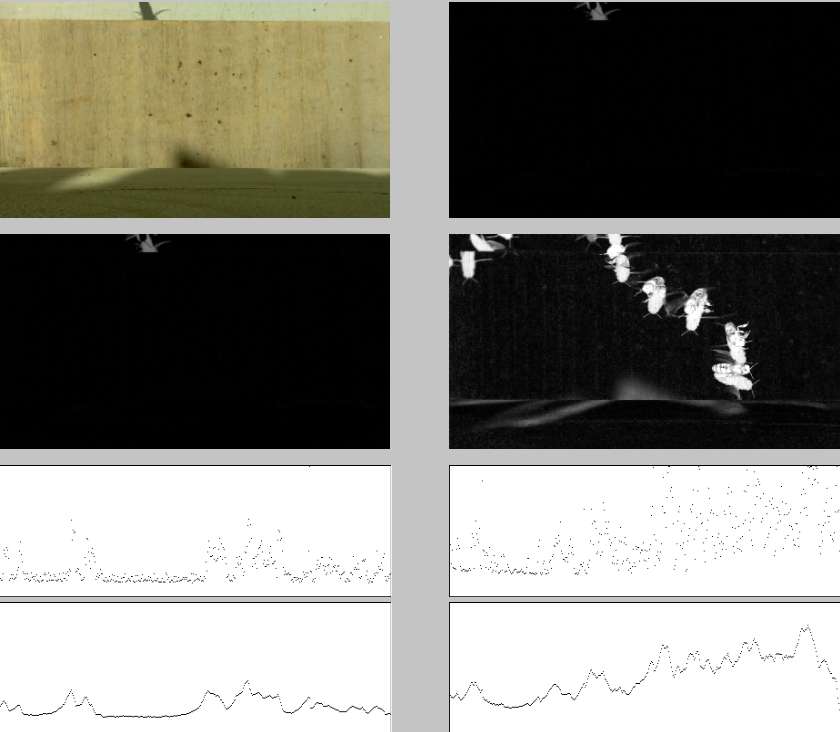
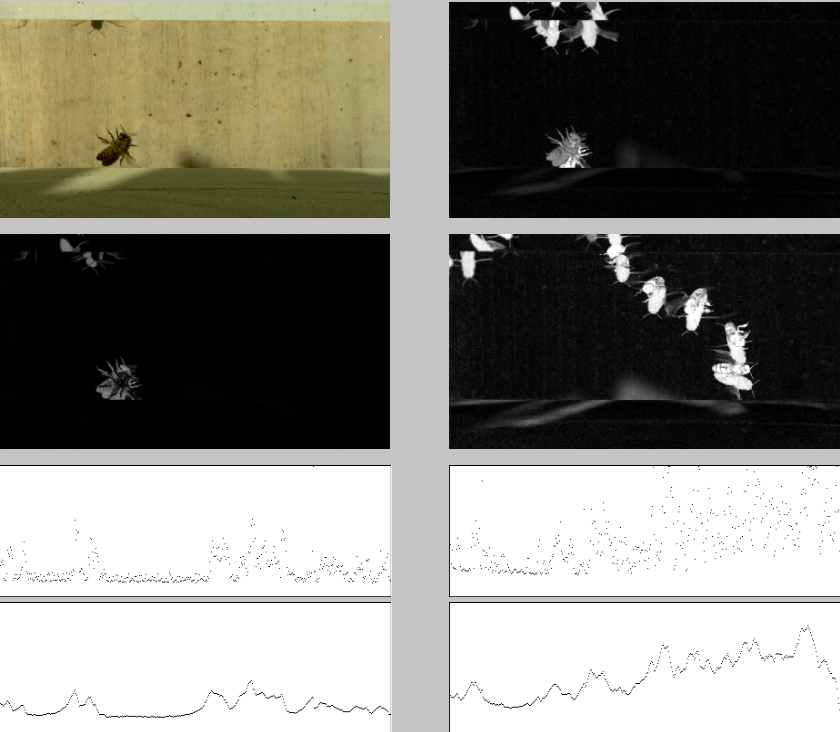
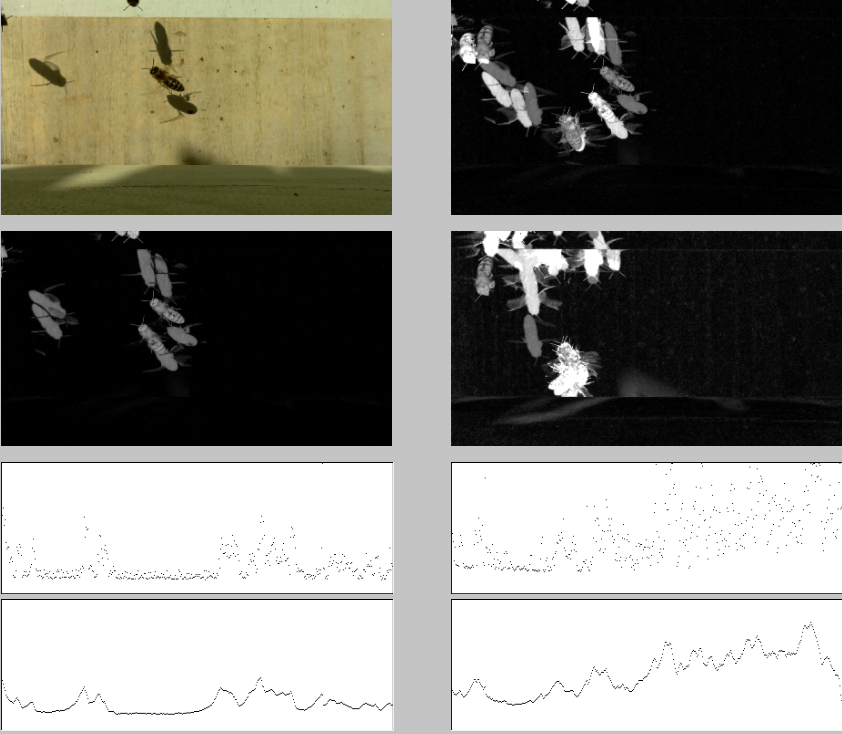
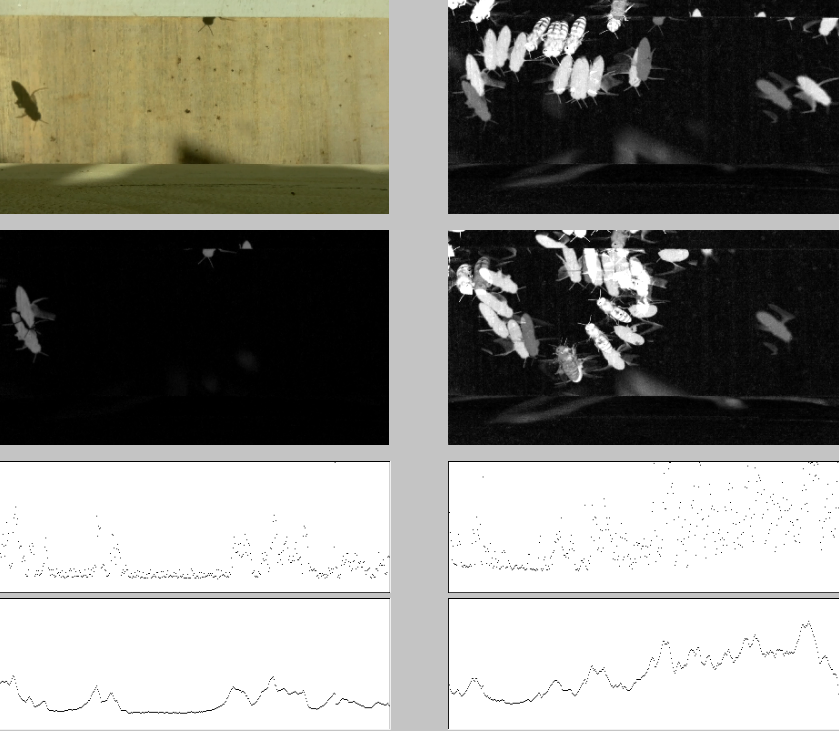
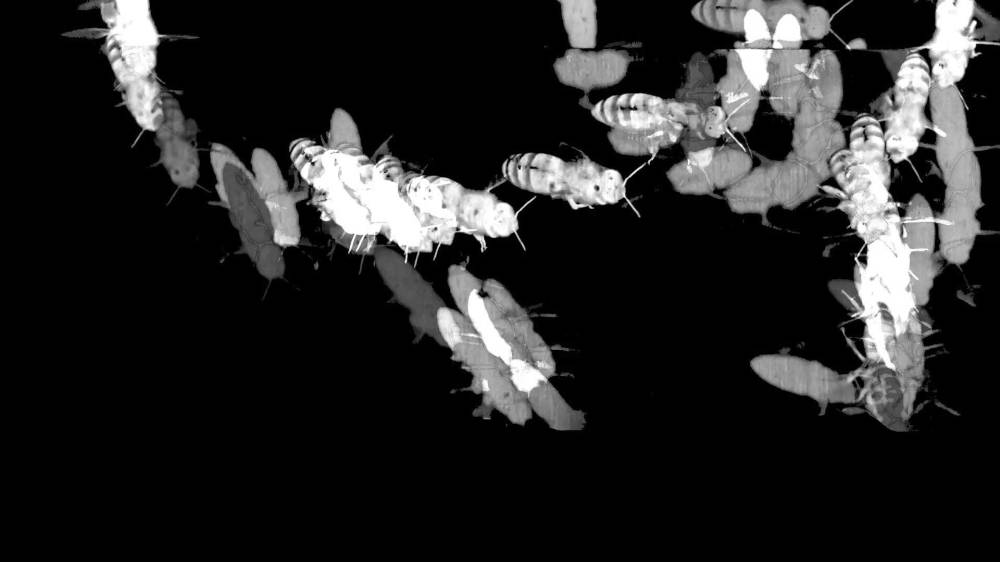
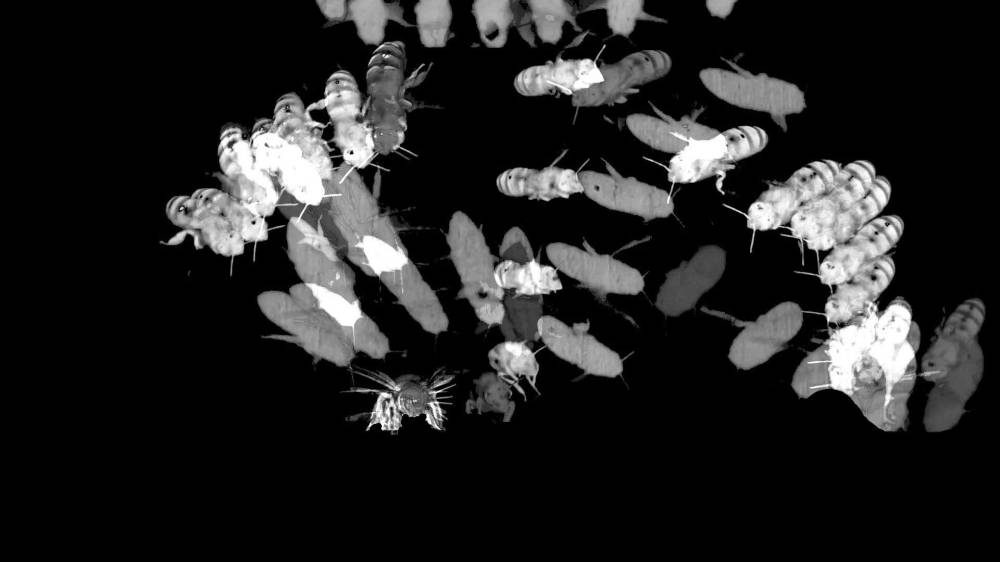
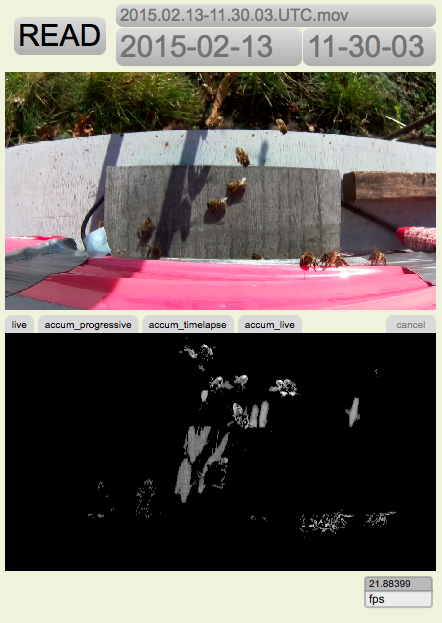
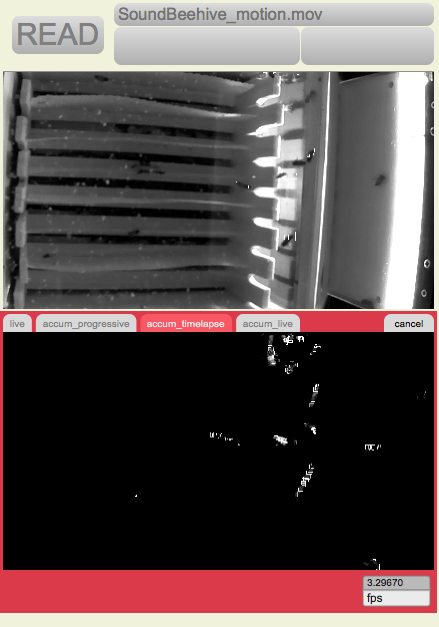
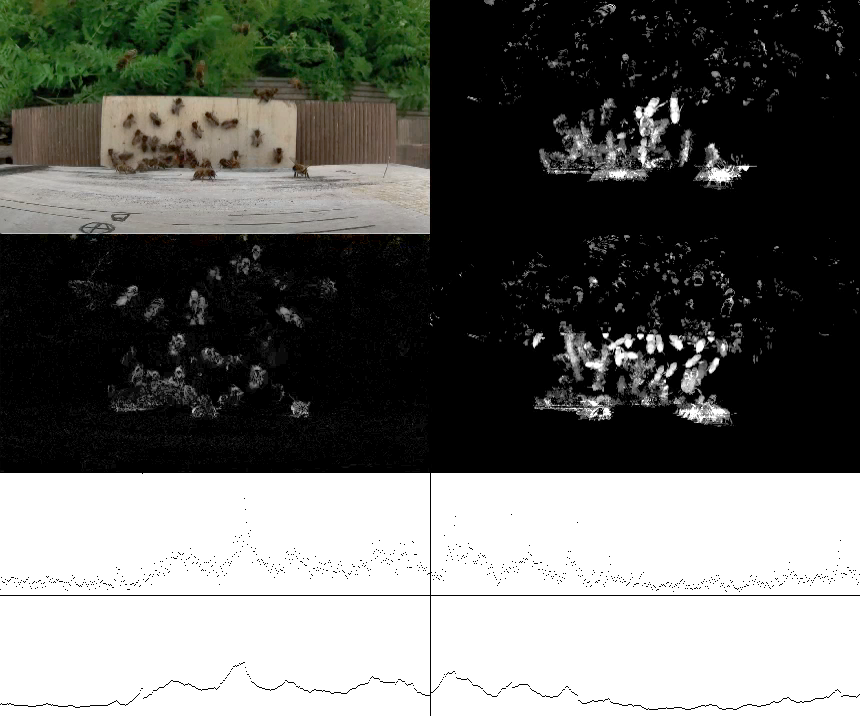
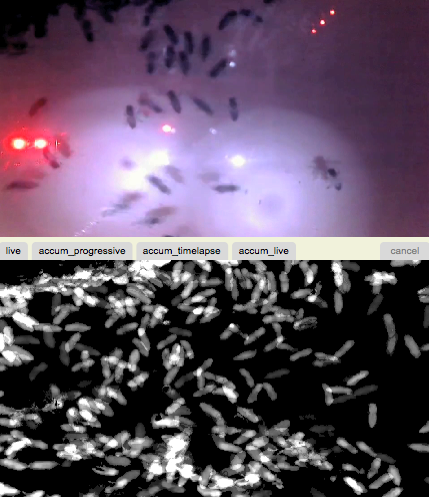
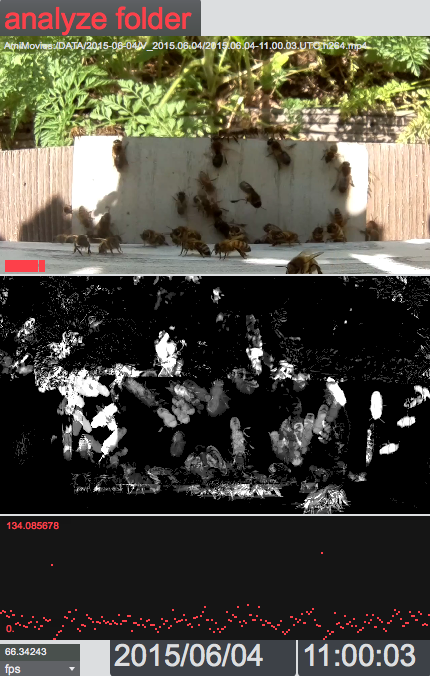
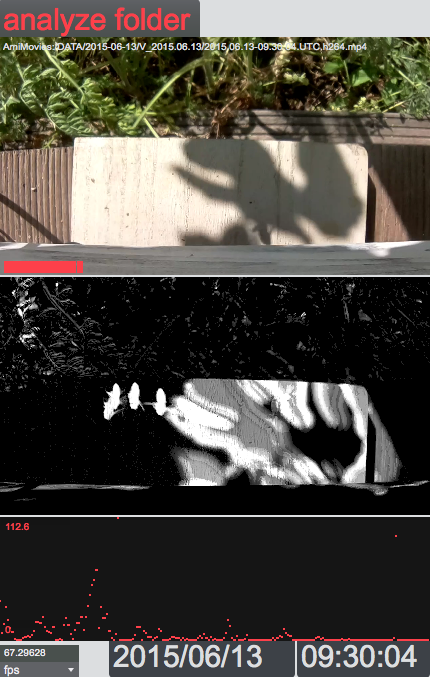
The analysis of the video files is done with motion detection (frame difference method - motion-detection.pdf). The analysis is based on frame difference. The first frame is captured through the static camera and after that sequence of frames is captured at regular intervals. Secondly, the absolute difference is calculated between the consecutive frames and the difference image is stored in the system. Thirdly, the difference image is converted into gray image and then translated into binary image. Finally, morphological filtering is done to remove noise.
Thus, over 10 images there is a frame-information substraction between the consecutive images. The results of this substractions are added up after the 10th frame and displayed in a new window. The noise is filtered out of the frame.
The information read in the first analysis display and the info from the 4th display are both rendered in a graph and exported in cvs-format.
motion detection
accummulation of consecutive images
The cvs-files of the 8 audio/microphones (3 lists per channel: brightness, loudness and noisiness) gives us 24 possible parameters. The video-file analysis is limited for the moment to light/brightness and motion. Later we will add the minimum color and the average color of the image as an extra parameter.
The environmental sensors give the values of temperature, humidity and hours of sunlight, as well as the temperature and the humidity inside the beehives.
All added up this gives us plenty of parameters to combine and to play with, and to create a virtual bee-blob moving and changing by these strange attractors-parameters.
stills from analysis videos

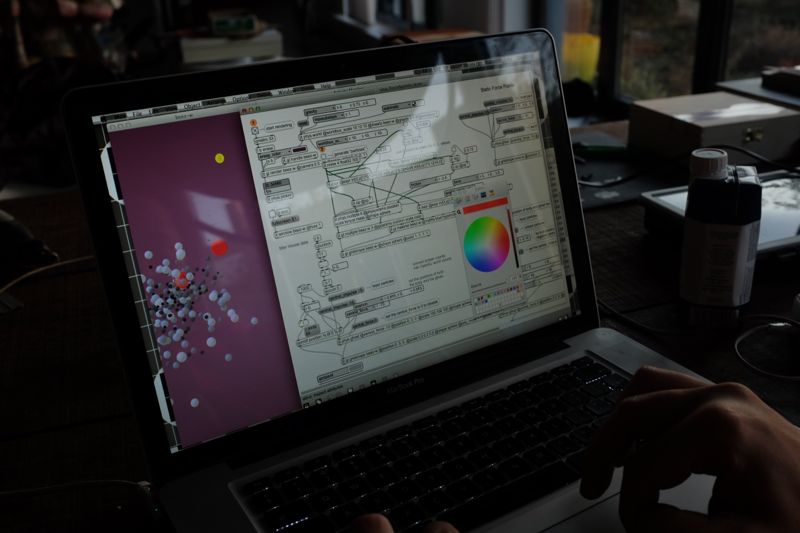
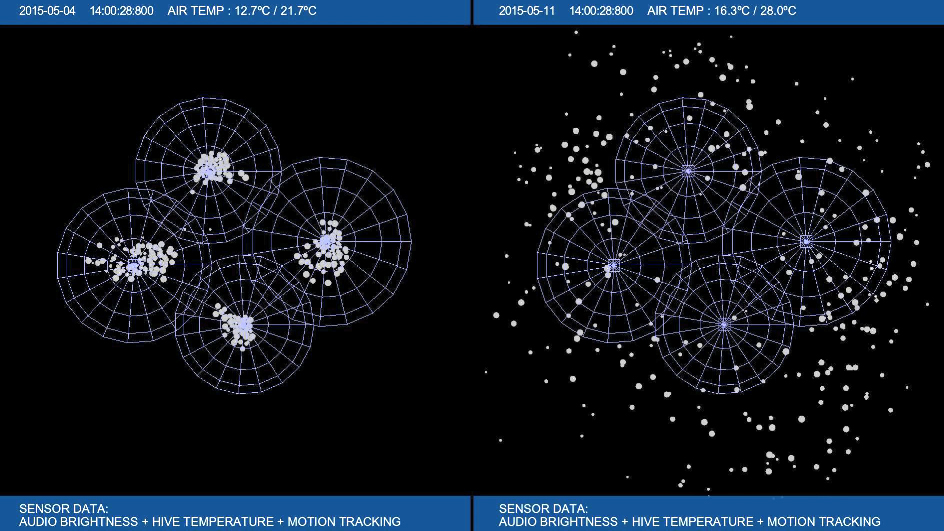
We started to build the interface for visualisation. It is not easy.
First we had normalised all data to the .cvs format. Than, we tried to normalize the data in time. E.g.: sound has continuous data for 3 minutes, 4 x per hour. Temp. sensors take data every 10 minutes, video is continuous for 3 minutes 4 x/hour, …
The first patch in MaxMSP shows that the lists with values are far too long. We simplify. For sound and video, we take only 1 minute instead of 3 minutes/file. Than, we make an average of 10 values - so we reduce the figures with :10.
The environmental sensordata (temp. &hum. ,solar radiation, …) are extended to the same format.
So finally we have regular values, and for all parameters the same format.

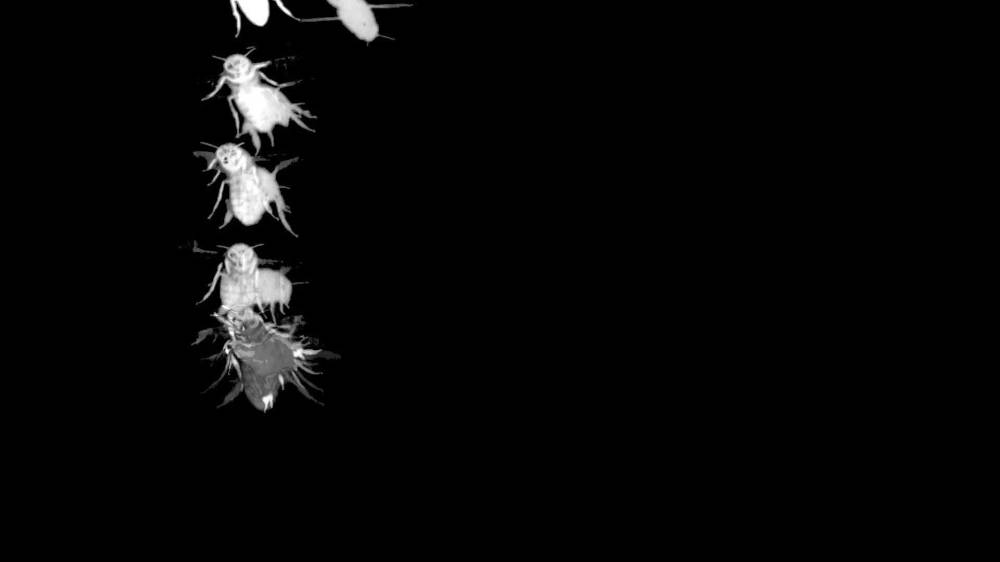
Intermediate patch: motion tracking on recorded images, a little tool for quickly visualising the bee-action.
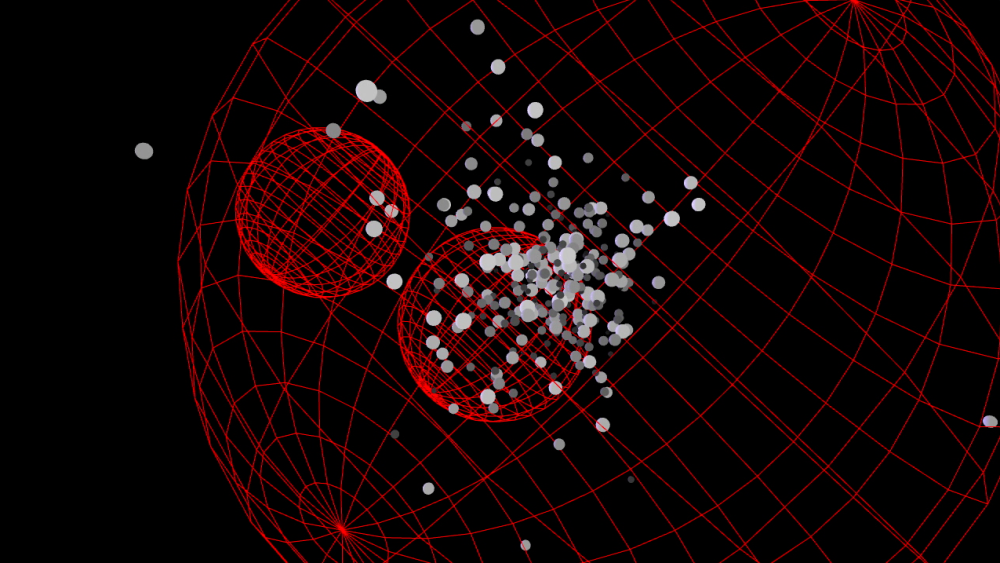
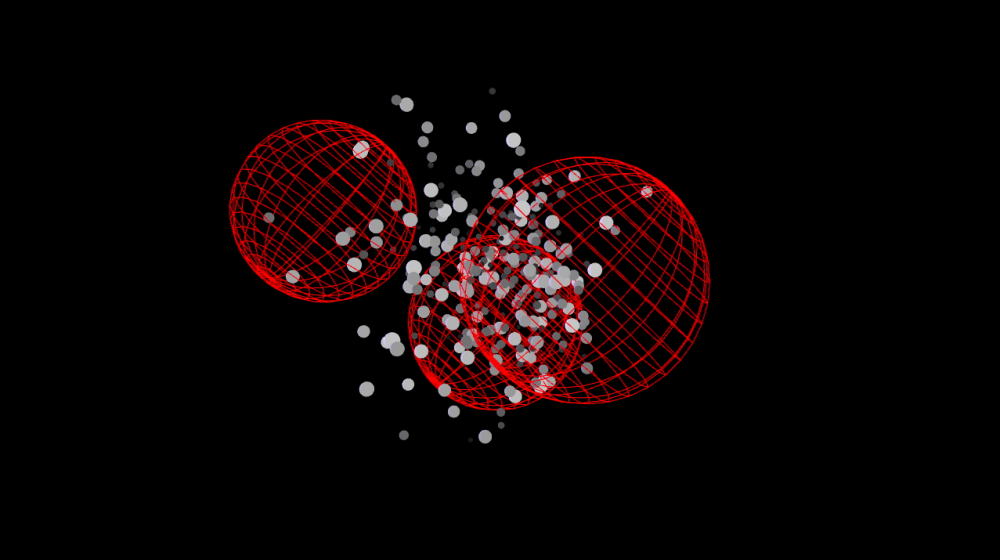
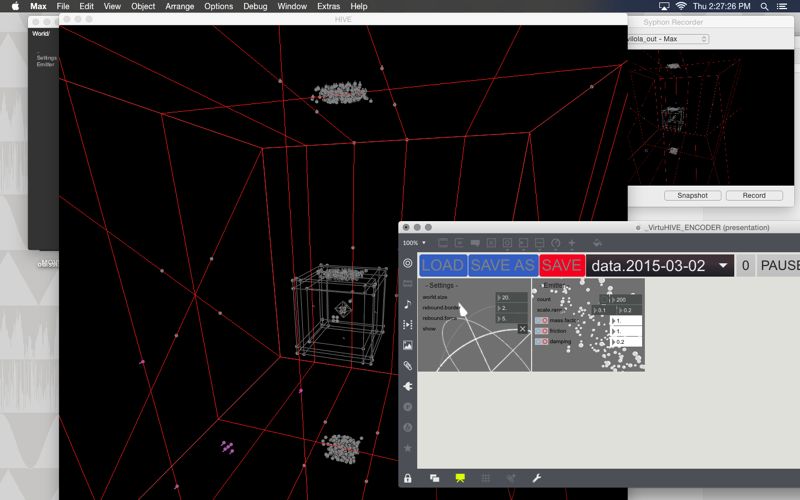
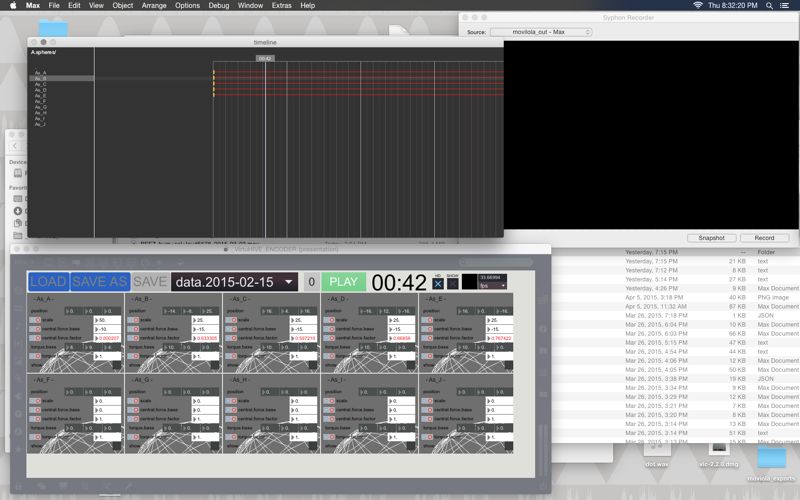
Now we have to introduce these parameter values into the MaxMSP-patch. The values are attributed to the attractor-engines. They define a stronger or weaker strength, which makes the blob of the spheres move in the 3D-space.
We started with a blob of 300 spheres (representing the bees). 300 is a limit for the Max-patch when run on a Mac PowerBook. We try to increase the number up to 500 spheres, but this makes the patch crash.
We make the data run in a first time for a while with different parameters and make some test-movies.


VLC-bees in 3D and red
We started to work on the camera images of the Sound Beehive, version 2015. The camera frames as well the 8 frames of the beehive on which the bees will build out the new comb - at the same time the camera also frames the IN/OUT portal (in plexiglass) through which the bees leave and come back into the beehive. With these images we will make a bee counter.
Hive activity on the first summer day, 10.04.2015, 20°
Left, the broodbox filmed from bottom-up - right, the entrance with the beecounter.
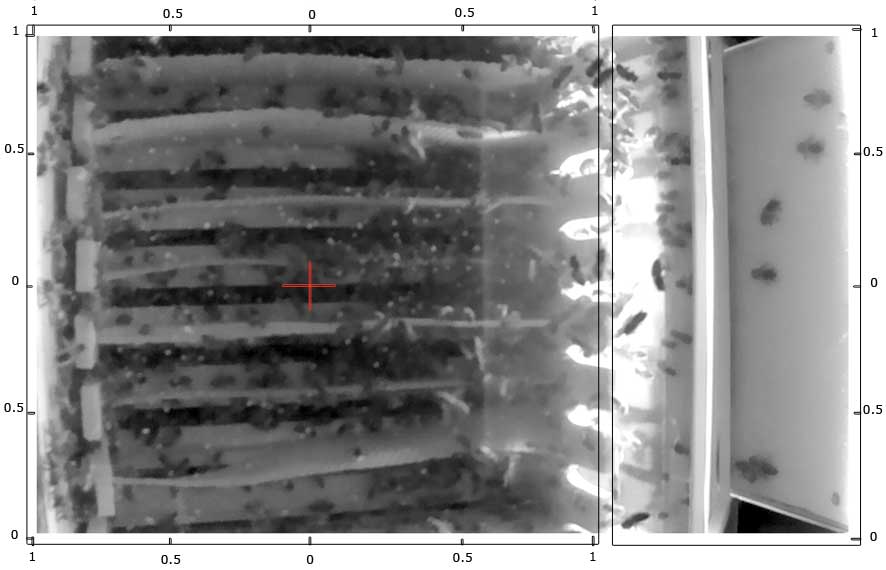
We are filming the nest from bottom-up at 2fps. This makes a movie of 2 minutes every hour, or 48 minutes/day (played at 60fps). Once we have a lot of time, we will make a concatenated movie out of all fragments.
All day we leave and arrive at the hive,
concelebrants. The hive is love,
what we serve, preserve, avowed in Latin murmurs
as we come and go, skydive, freighted
with light, to where we thrive, us, in time's hum,
on history's breath,
industrious, incidental …
there suck we,
alchemical, nectar-slurred, pollen furred,
the world's mantra us, our blurry sound
along the thousand scented miles to the hive,
haven, where we unpack our foragers;
or haven-stare, drone-eyed, for a queen's star;
or nurse or build in milky, waxy caves,
the hive, alive, us - how we behave.
—– The Bees (hive), Carol Ann Duffy, 2011
tests, patches for visualisations movies -2015 04 13/14/15


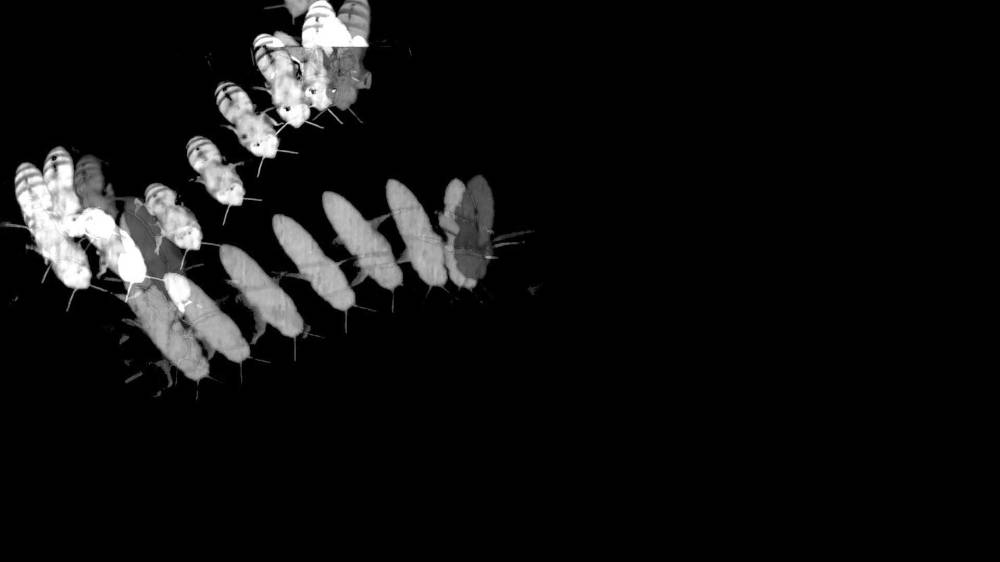
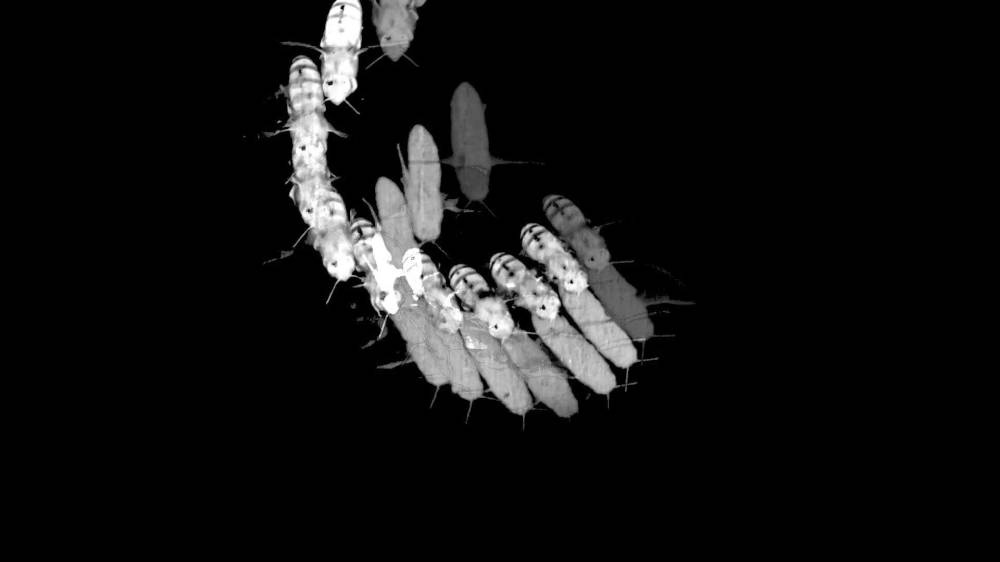
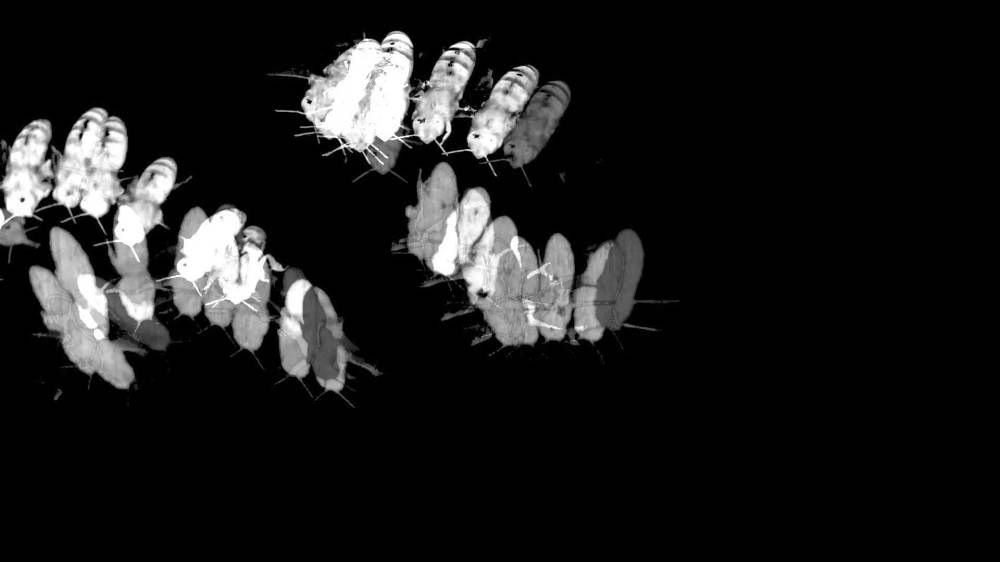
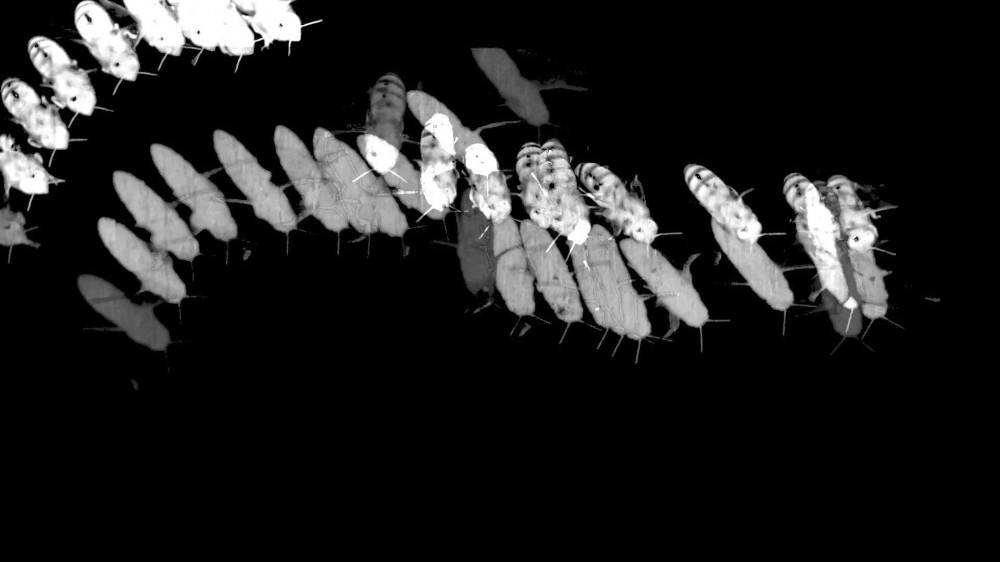
finally, some results for the data visualisation
examples for the virtual bee-world [to build]
voorbeelden voor visualization diagrams: http://www.wolfram.com/products/mathematica/newin6/content
other keywords: scattered plot, point cloud
/HighImpactAdaptiveVisualization/
sensor data cvs-files
sound beehive (warré)
https://p2pfoodlab.net/community/people/okno/dataset/71
temperature/inside: http://opensensordata.net/datastreams/51596.csv
humidity/inside: http://opensensordata.net/datastreams/51597.csv
intelligent beehive (warré)
https://p2pfoodlab.net/community/people/okno/dataset/7
temperature/inside: http://opensensordata.net/datastreams/113.csv
humidity/inside: http://opensensordata.net/datastreams/114.csv
beehive 1 (kempische)
https://p2pfoodlab.net/community/people/okno/dataset/27
8768, 8769, 8770, 8771, 8772, 8773
beehive#1/temperature/inside: http://opensensordata.net/datastreams/8770.csv
beehive#1/humidity/inside: http://opensensordata.net/datastreams/8773.csv
beehive 2 (kempische)
https://p2pfoodlab.net/community/people/okno/dataset/27
beehive#2/temperature/inside: http://opensensordata.net/datastreams/8769.csv
beehive#2/humidity/inside: http://opensensordata.net/datastreams/8772.csv
temperature and humidity Forest Garden
https://p2pfoodlab.net/community/people/okno/dataset/27
temperature/outside: http://opensensordata.net/datastreams/8768.csv
humidity/outside: http://opensensordata.net/datastreams/8771.csv
waspmote
https://p2pfoodlab.net/community/people/okno/dataset/38
air temperature: http://opensensordata.net/datastreams/8879.csv
air humidity: http://opensensordata.net/datastreams/8880.csv
soit temperature: http://opensensordata.net/datastreams/8881.csv
soil humidity: http://opensensordata.net/datastreams/8882.csv
solar radiation: http://opensensordata.net/datastreams/8883.csv
leaf humidity: http://opensensordata.net/datastreams/8884.csv
Invisible Garden
https://p2pfoodlab.net/community/people/okno/dataset/32
okno p2p
https://p2pfoodlab.net/community/people/okno/dataset/33