This is an old revision of the document!
Data Weaving
The sensing devices (microphones, video cameras, sensors) extract information from the beehive, the colony and the environment.
These sensor readings need to be translated into a visualisation process.
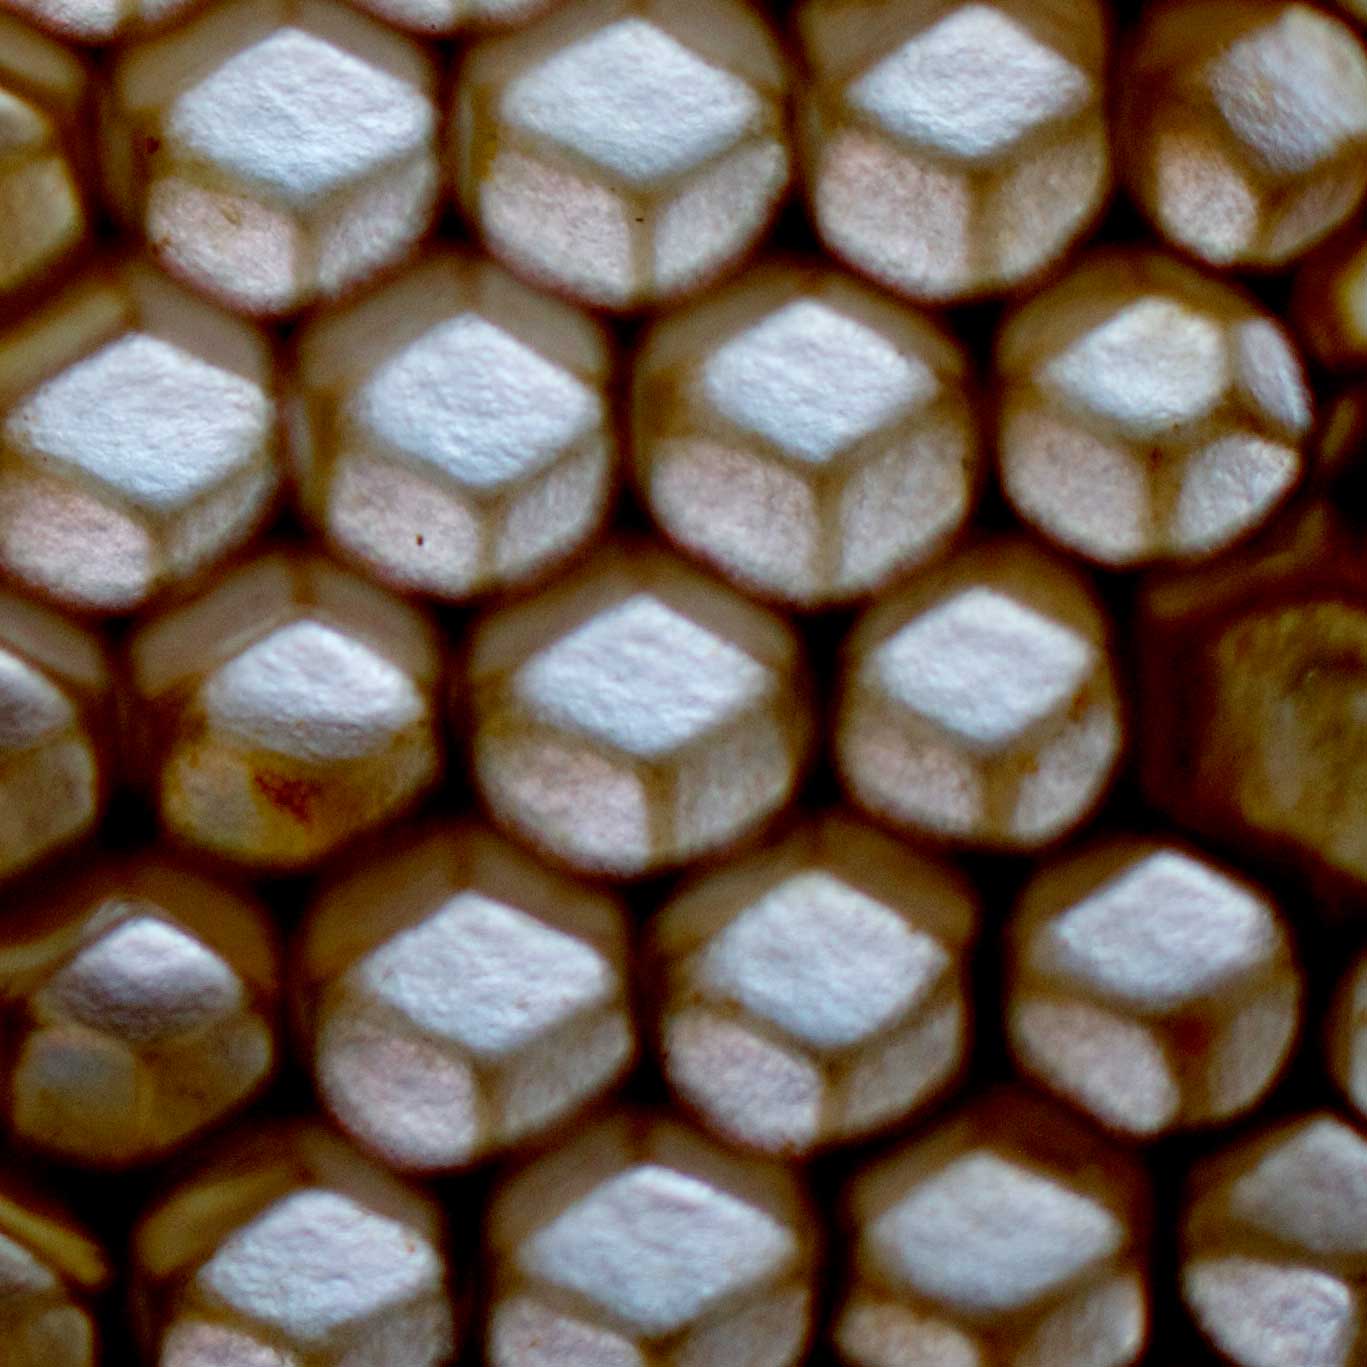
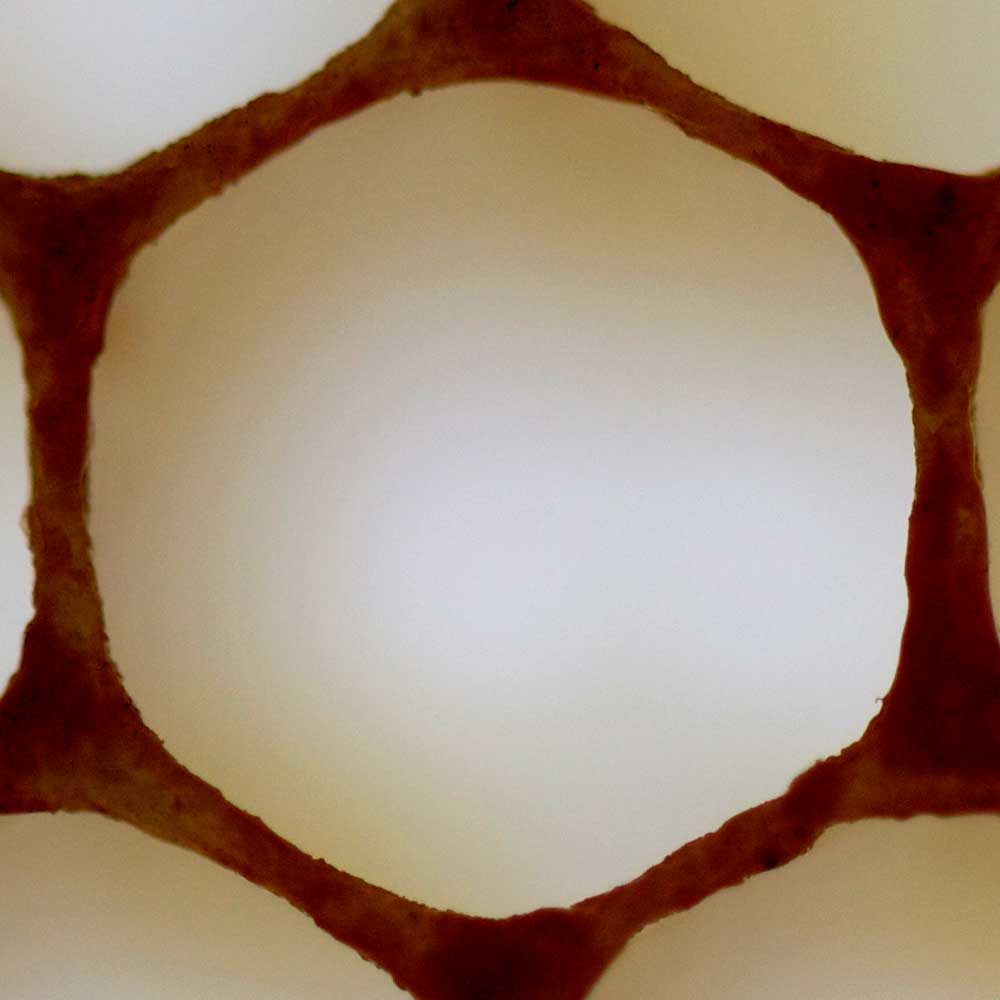
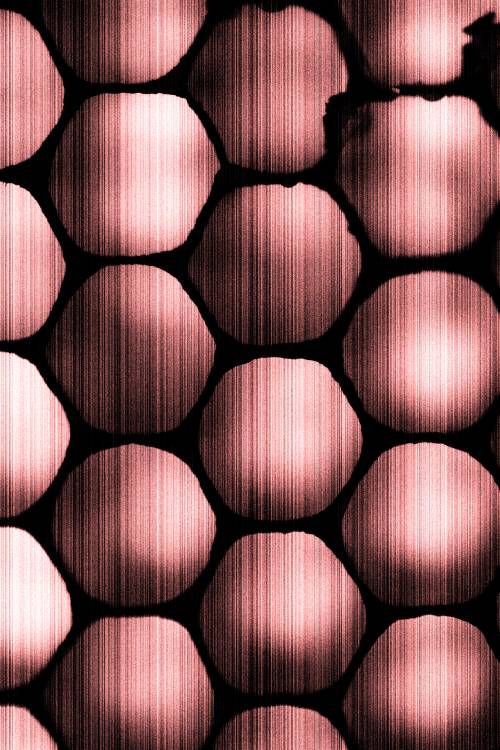
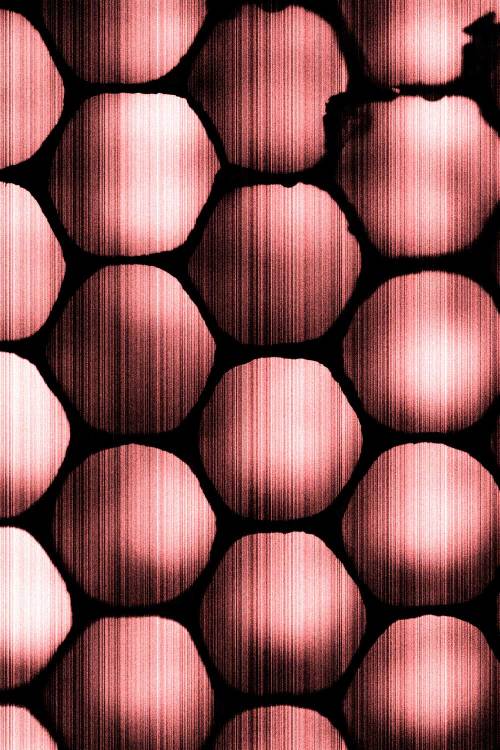
My starting point, concept and metaphore, is the technique of weaving. The weaving designs have a mathematical basis and all information relates to dots, points or pixels. The bee comb is constructed out of an hexagonal pattern in which every cell can be approached as a pixel. Another bee element that relates to dots and pixels are the panoptical bee eyes, formed out of more than 6000 individual hexagonal facets.
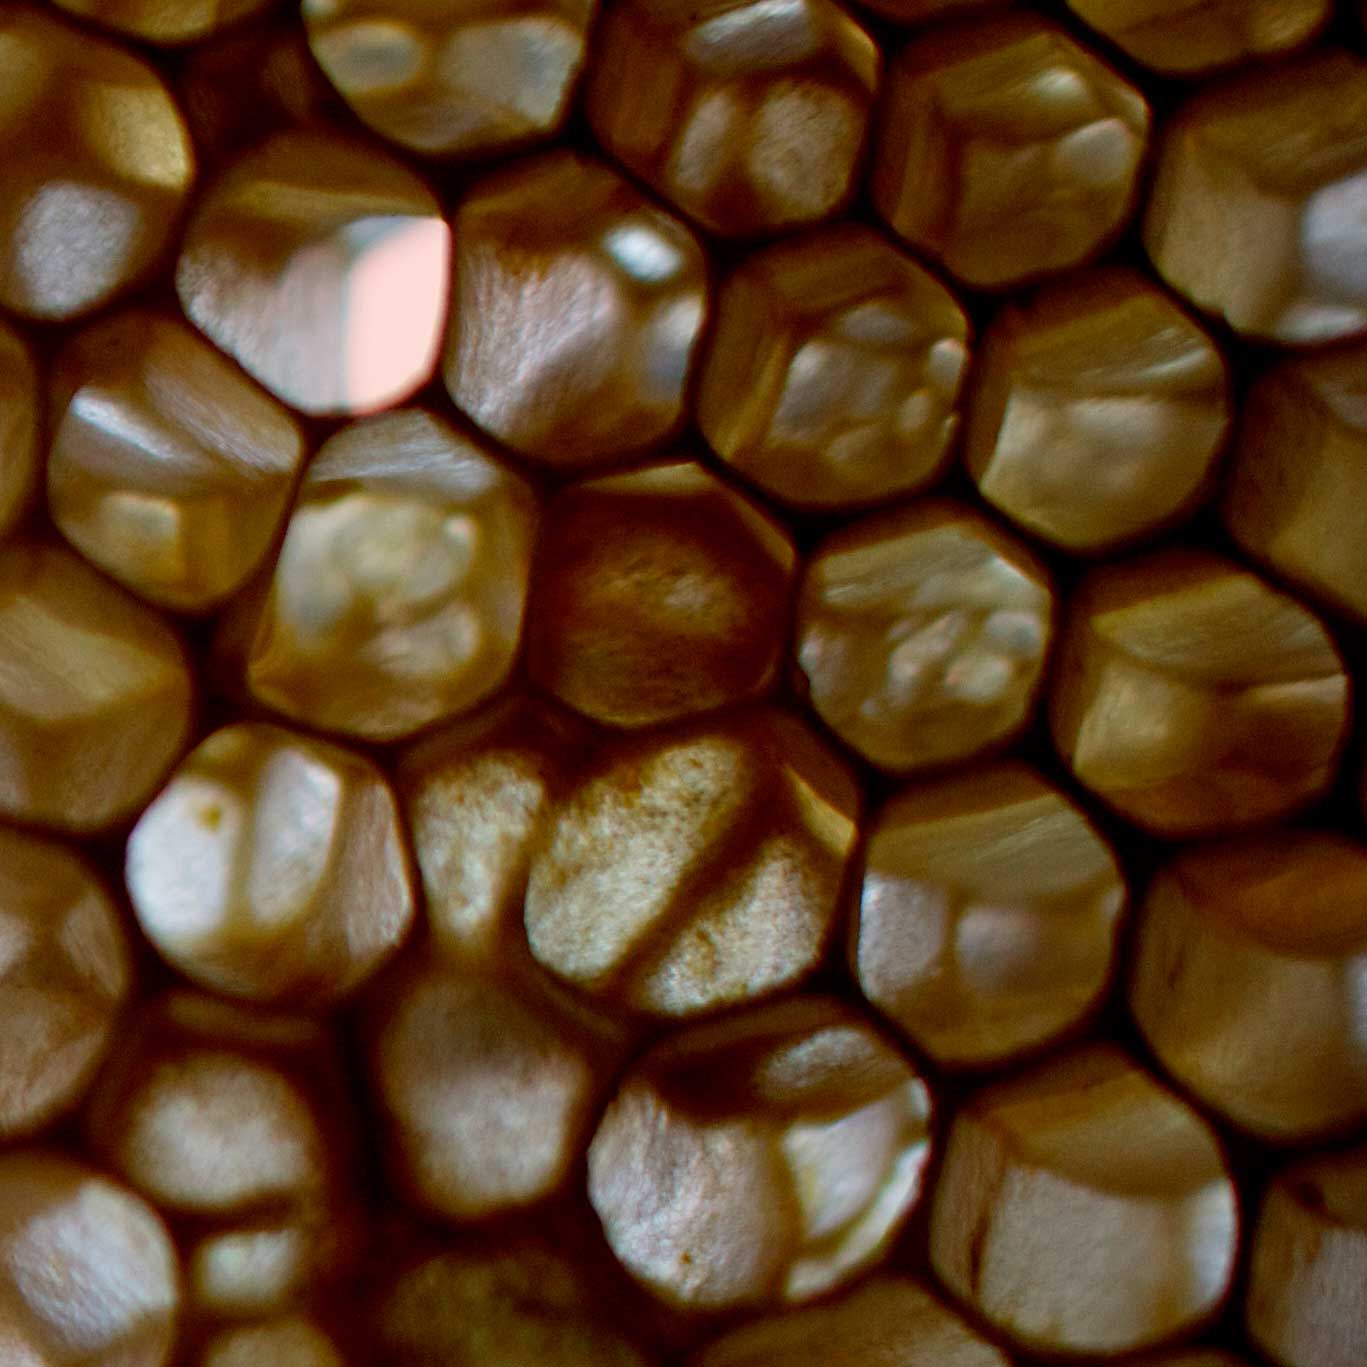

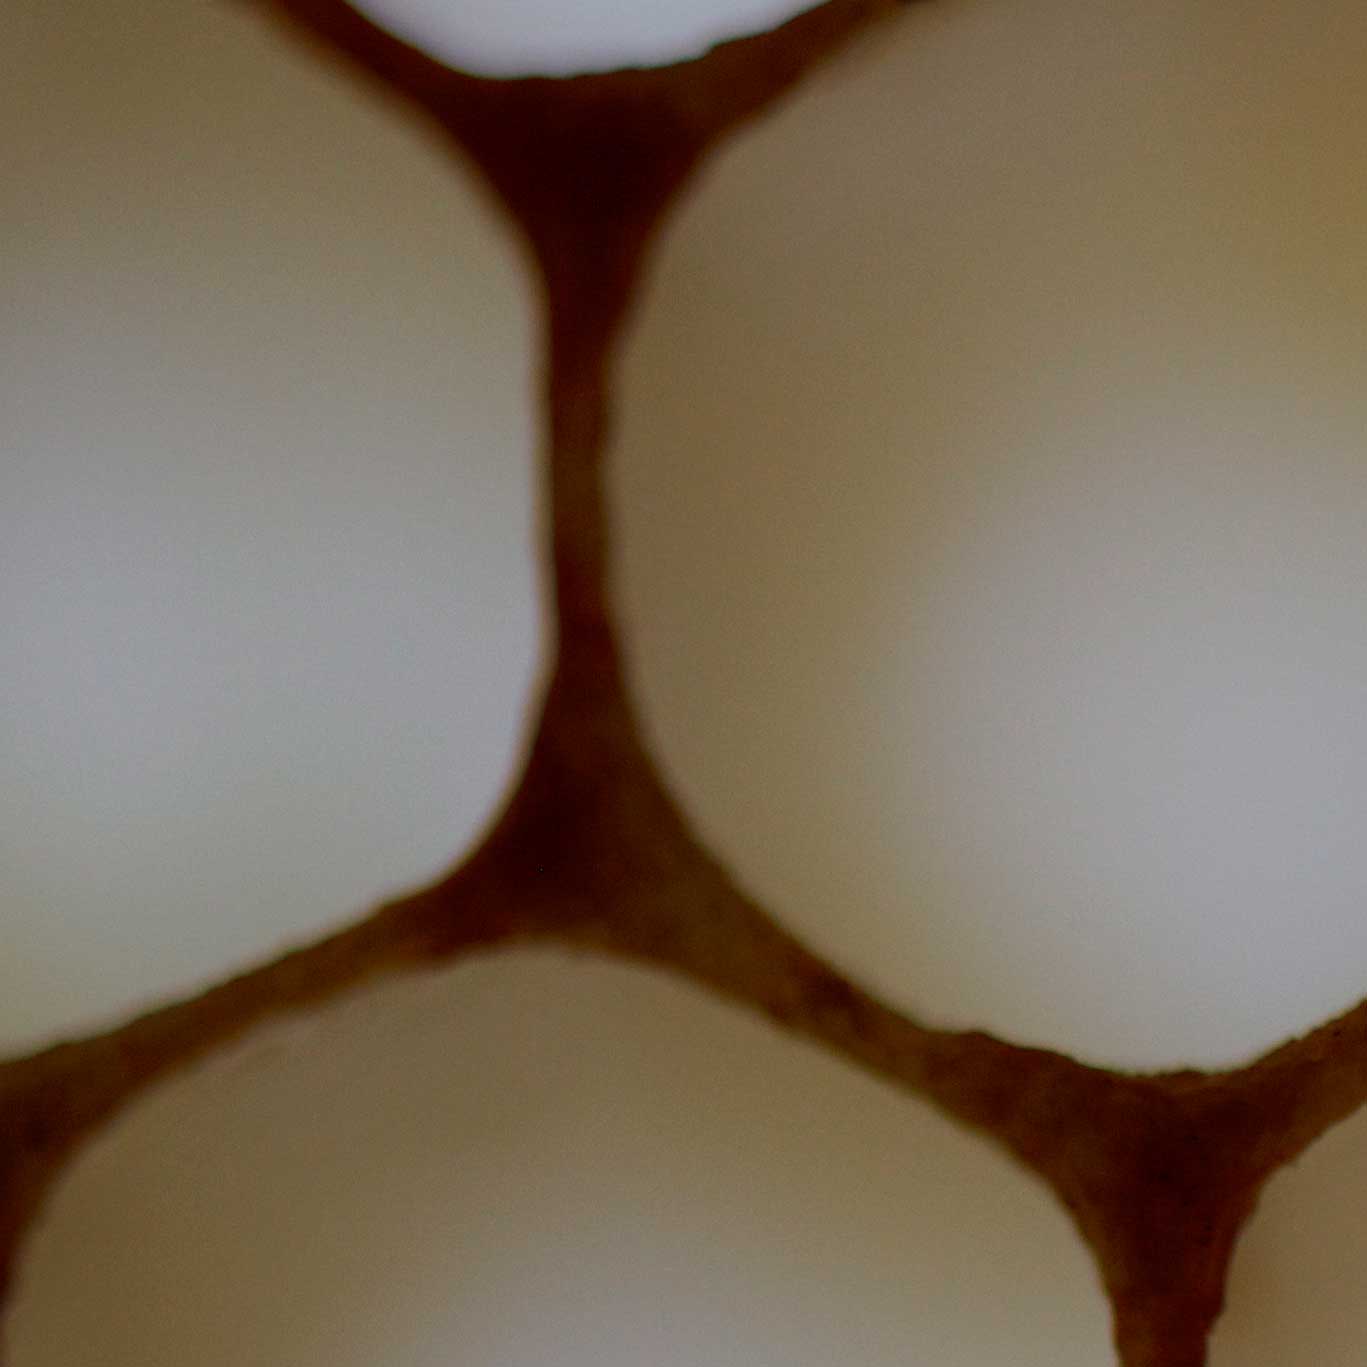
atipical bee comb
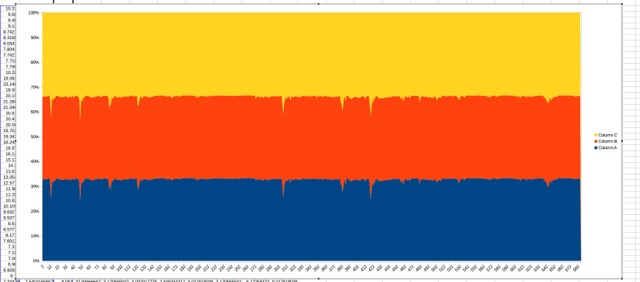
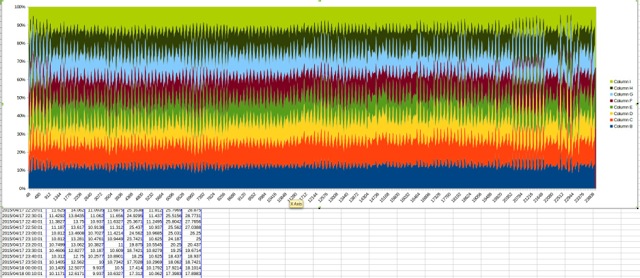
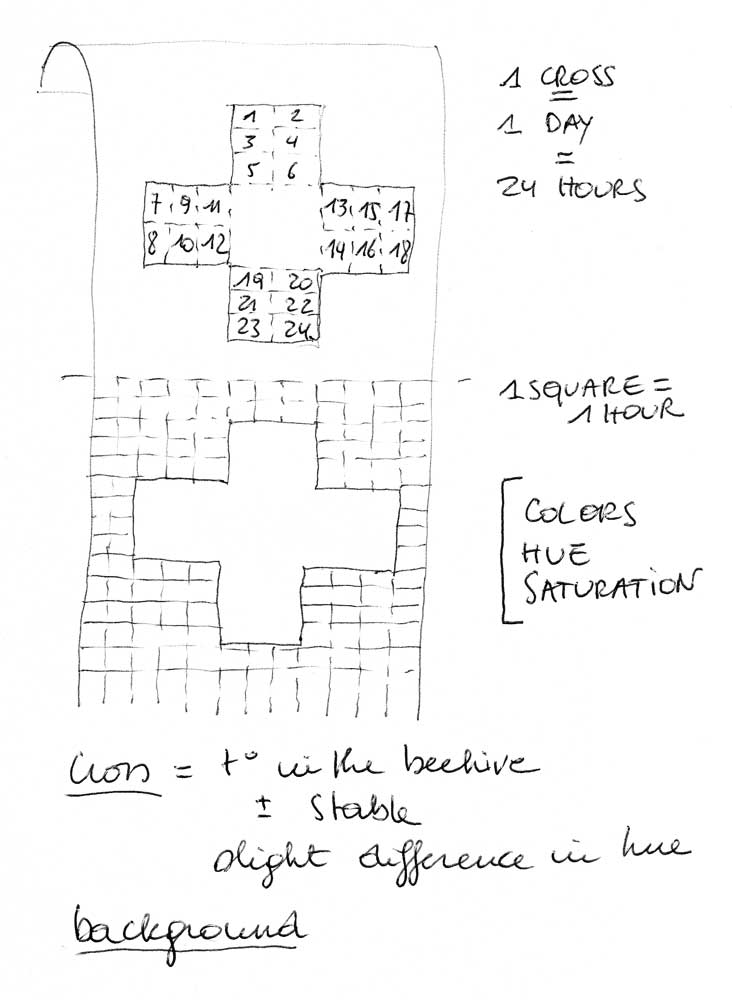
yellow = air temperature, orange = solar radiation, blue = soil temperature
6 temperature sensors in the beehive over 6 months
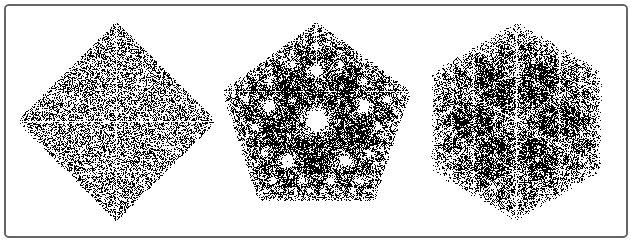
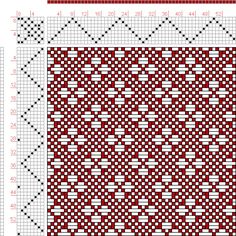
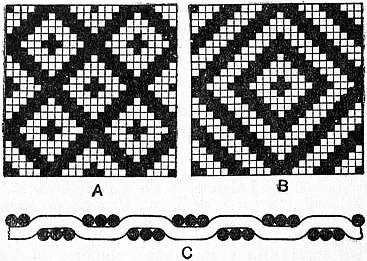
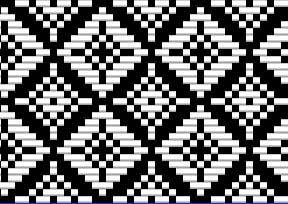
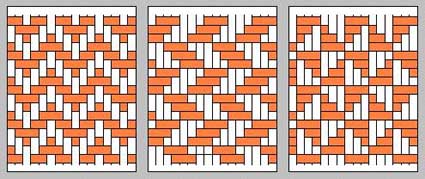
some examples of jaquard-weaving design:
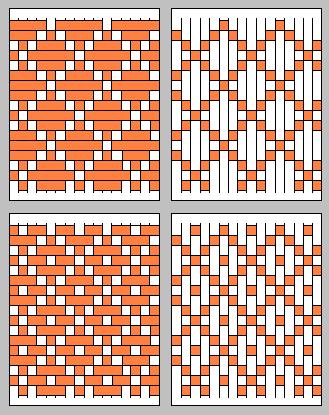
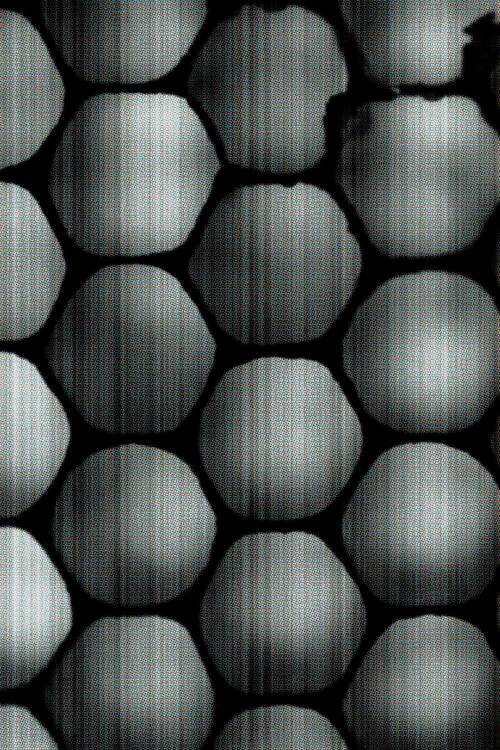
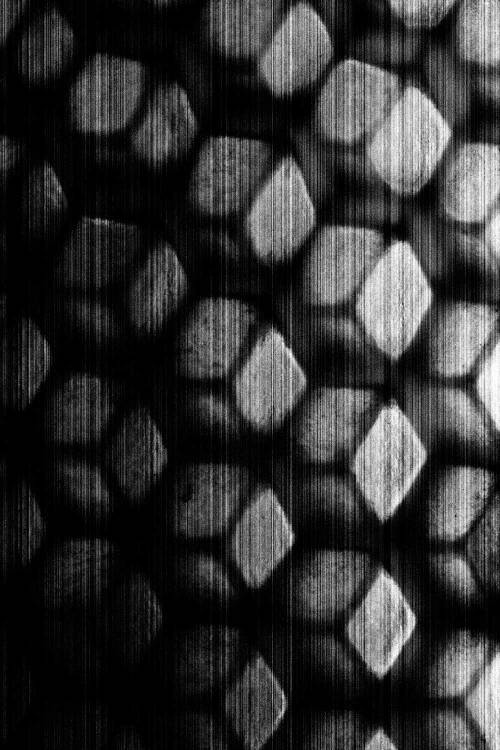
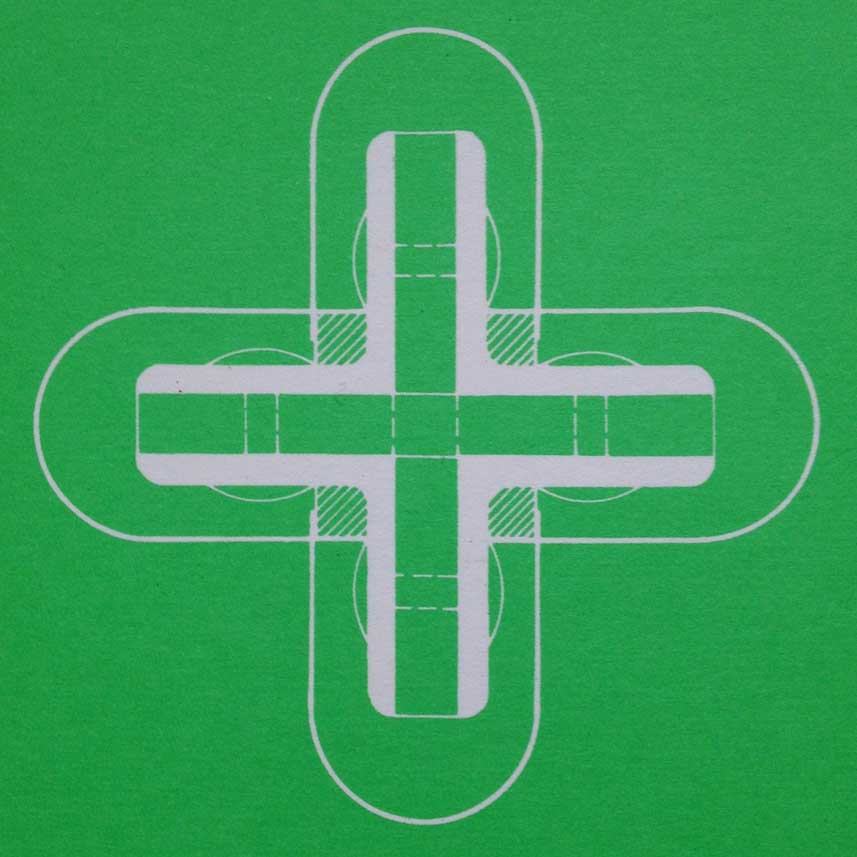
comb weaving
The purpose is a visualisation of the bee-data. Data express also the relation of the honeybee colony to its environment and to the foraging fields.
This approach gives the possibility to study the (urban) environment in a critical way.
Bee-data: (outside) bee counter on the landing platform, amount of bees flying in/out, (inside) development of the colony filmed with the IR cameras.
Environmental data: air temperature, air humidity, hours of sunshine, rainfall, wind flows & direction.
Foraging Fields: calendar of blooming period of the most important plants in the urban foraging fields.